


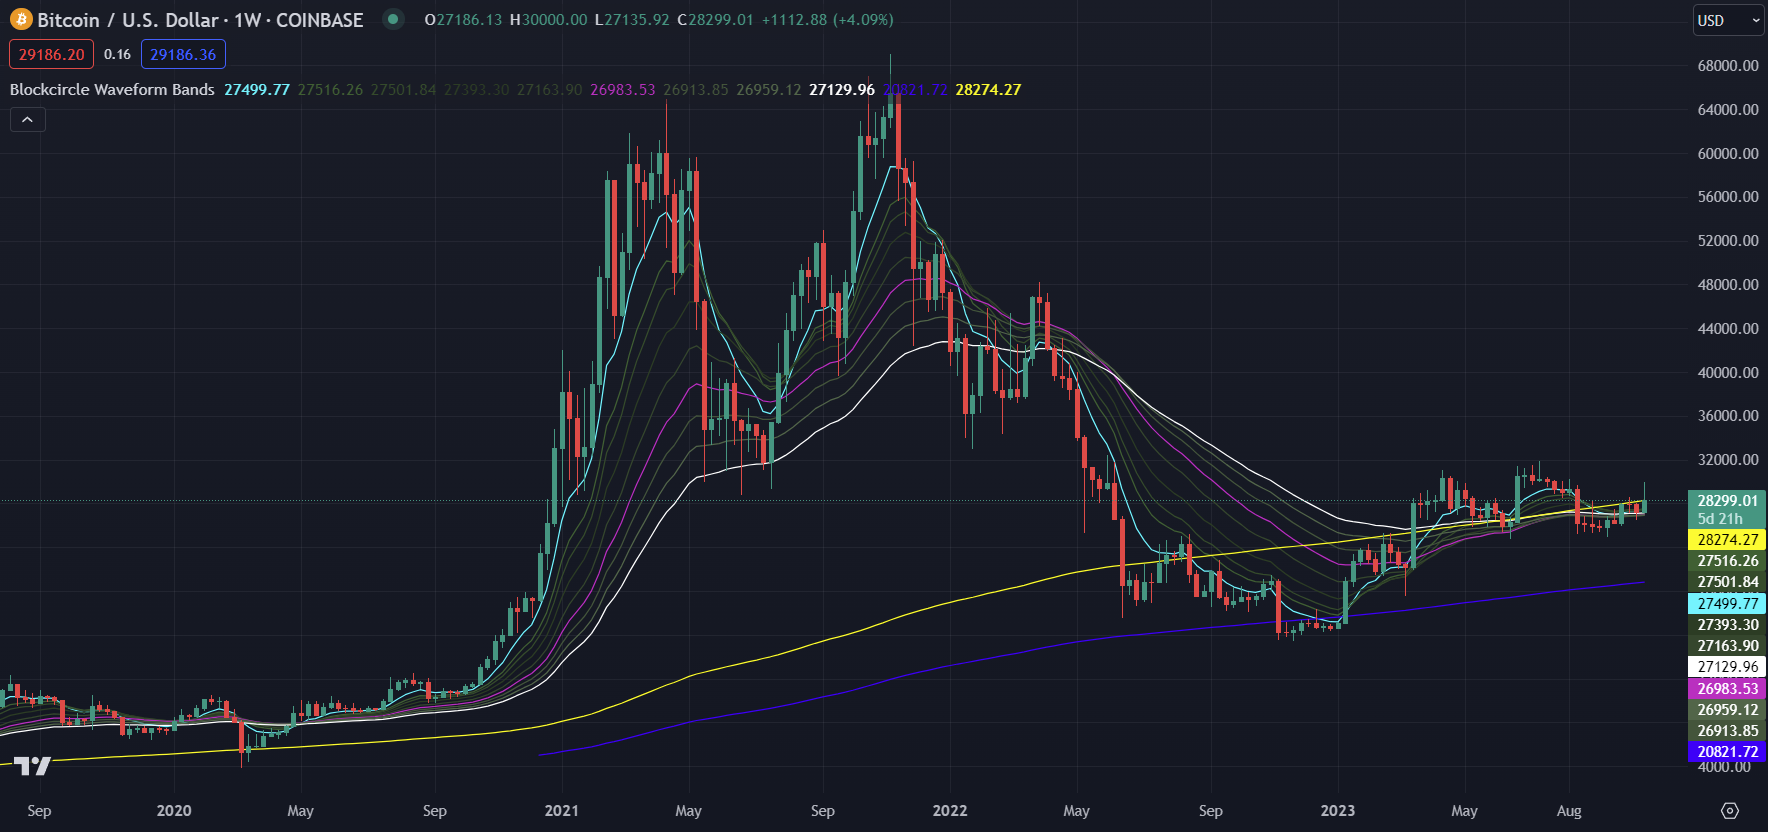
Identifying the Blockcircle Waveform Bands
The Blockcircle Waveform Bands include 11 charting lines, each of which represents a particular mathematic calculation. In this guide we will start to identify the Bands and what they mean.
Opening the Settings of the Waveform Bands will help us to understand what each feature is. We have 3 tabs we can explore, Inputs, Style and Visibility (not used in this guide).
Inputs
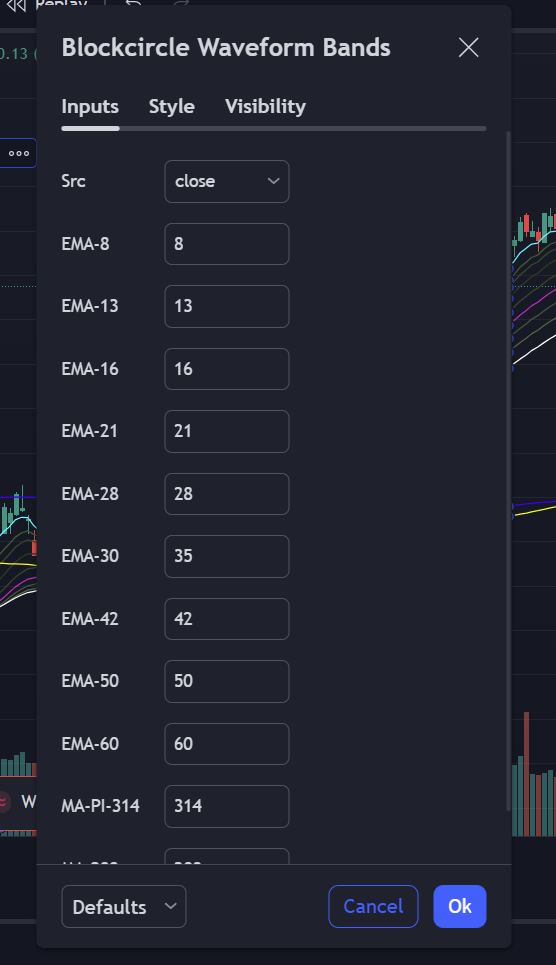
On the Inputs tab we can see multiple values (numbers) which will set the period of each line added to your chart. For example, the EMA-8 is showing the 8 period. We shouldn’t need to adjust these values unless you decide you would like to customise your EMA and MA periods.
If you have any difficulty, you can always reset the Blockcircle Waveform Bands back to Defaults.
Style
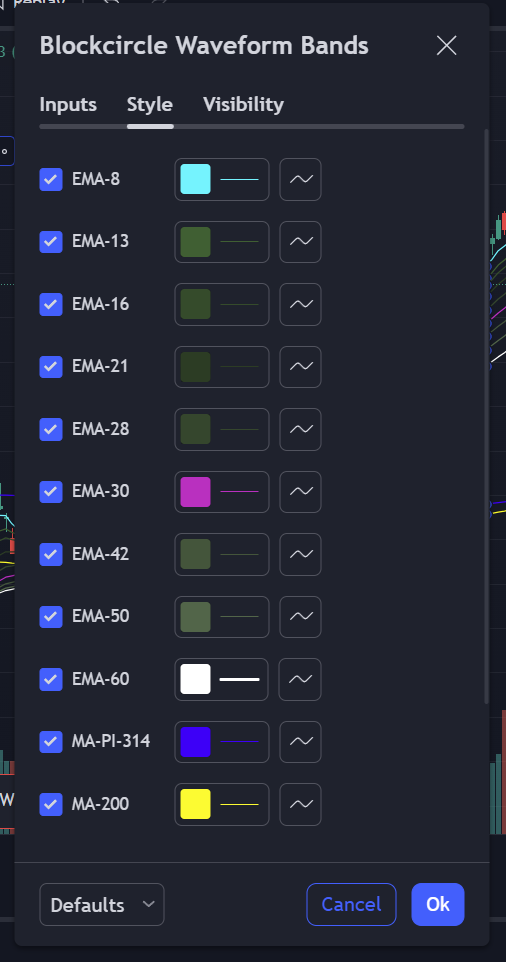
Let’s begin exploring the Style Tab by switching to the 1 day timeframe/interval so we can see the Bands more clearly. Click and drag to change the price scale.
Now we will view the chart and toggle the visibility of the lines. First scroll with the mouse wheel to expand the chart area, then open Settings and try deselecting some lines to identify each MA and EMA. You can also select the colour and line thickness. Note how the default colours help us to see and use the Bands more clearly (covered in Part 3).
You can also toggle the Price Labels to the right, and the Values in the Status line as shown.
Summary
We have now learnt how to Find the Blockcircle Waveform Bands in Part 1, and Identity the EMA periods (8, 50, 200 etc), colour and values (shown on the Price Scale and Status bar) in Part 2.
In Part 3, we will cover more specifics about the EMAs and MAs that make up the Bands and How to Use them as an trader or investor.
Please now continue to Part 3: How to Use the Bands.