


Introduction
The Blockcircle Momentum Strategy Bot is a premium product offering for Blockcircle Members who are interested in trade signals based on the advanced set of technical analysis tools that Blockcircle has already been using to track the market, filter the noise and get an edge, and the Bot puts these powerful techniques in your hands.
The Bot enters a LONG trade when the momentum is strongly riding high into positive territory with significant strength and enters a SHORT trade when the momentum is strongly riding low in negative territory. It uses the T3-CCI, EMA, Slow Stochastic, and Heikin-Ashi technical indicators and candle charting types combined with advanced higher-time frame validation and invalidation rules.
There are several configurable ENTRY and EXIT conditions and it has endless configuration setups so that you can fully customize any strategy for any asset you want using the advanced parameters available.
This guide will focus on the Initial Setup within TradingView only. However, future guides and videos will be available to cover topics such as; setup for automatic trading through intermediary service providers, advanced trading and account setup strategies and ways to review and refine the performance of your Bot settings.
Access to all available TradingView Guides is Here.
Each Step includes a very brief Quick-Start Summary for Blockcircle Community Members with the confidence to push ahead quickly and highlighted in green. The Guide also includes a detailed explanation for a strong understanding of the Bot’s options and functions and reference if you need it.
Step 1 – Finding the Bot and Additional Custom Technical Indicators
** Quick-Start Summary ** Favorite and add the Blockcircle Momentum Trading Bot Indicator to your TradingView set-up from the Invite-only Script list then go to the next step.
Within your Blockcircle Web Account, you can add and update your TradingView Username. This allows you to access the Invite-only Scripts shown before.
You must have either a free or a paid TradingView Account, so log on now and navigate to the Supercharts. This will be the most familiar part of the website or App in either Dark or Light mode (Dark mode shown).
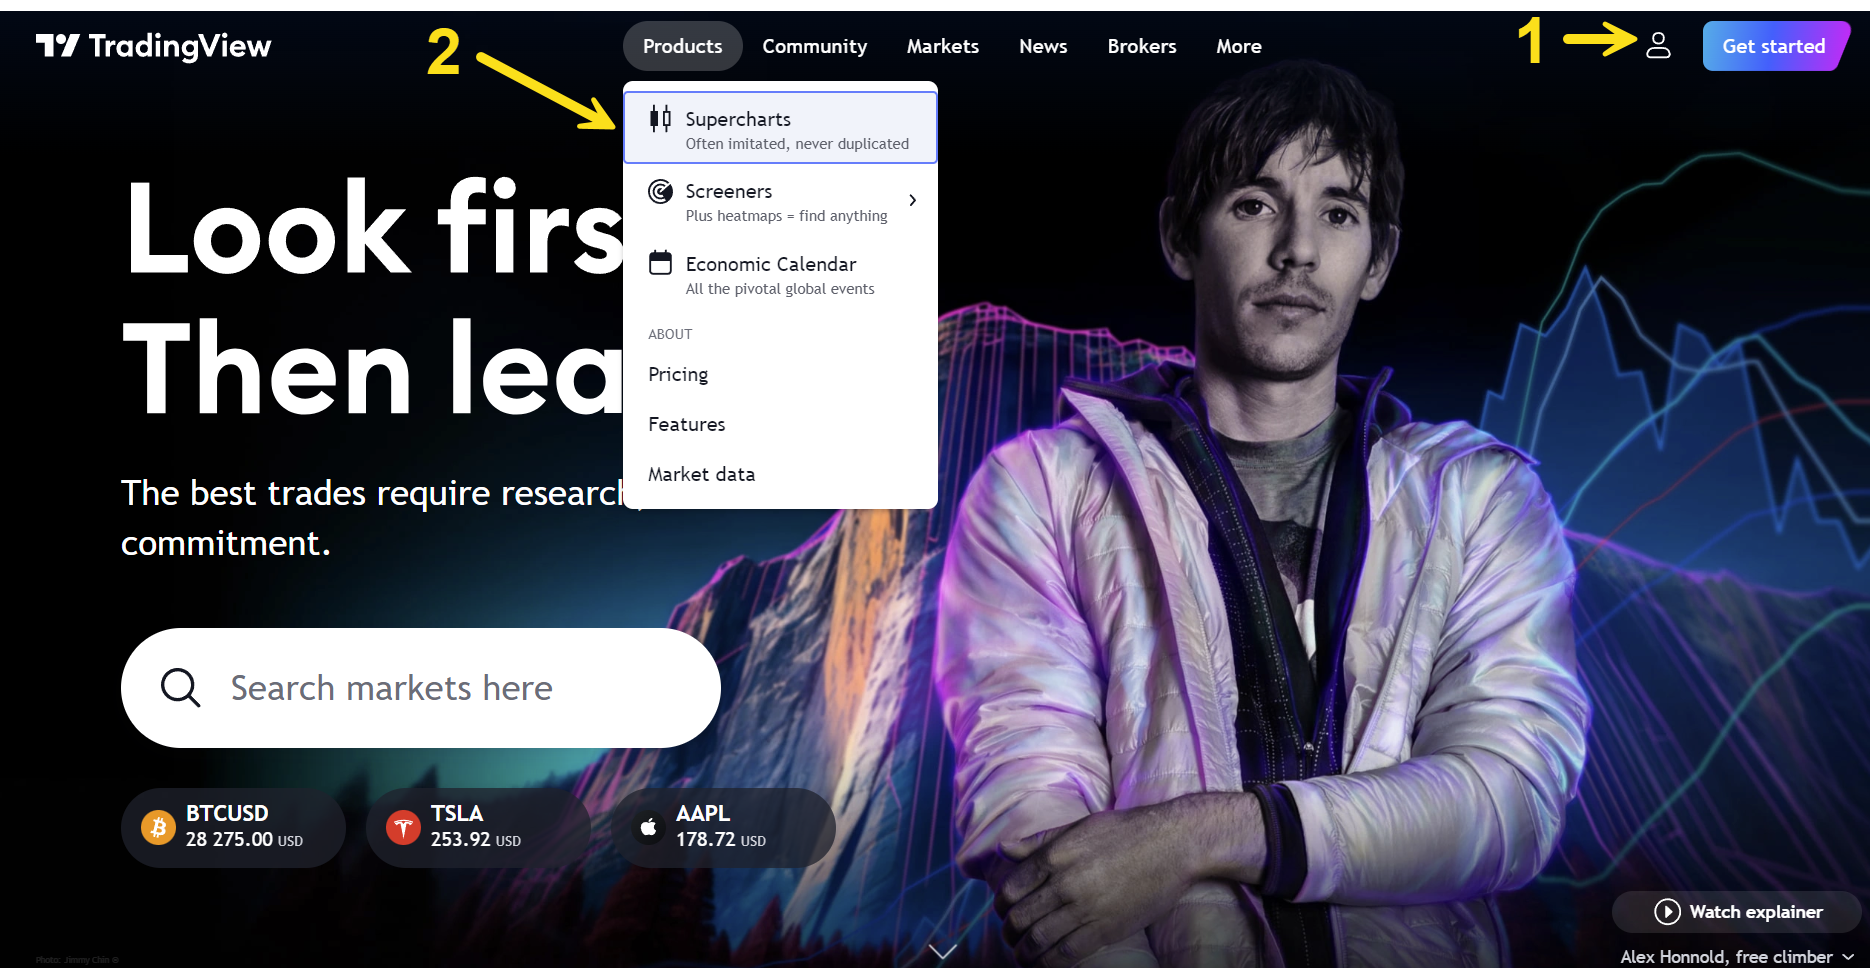
Once you are logged in to Trading View, navigate to the tab at the top of the screen. Here you will see the Premium Indicators you have access to published by Basel Ismail (bismail).
If you have other subscriptions/invites, these may also show up on this list.
At this point, we would recommend clicking the gold colored Star as shown to add the Momentum Trading Bot to your Favorites list for easier navigation while using this guide.
Please also note that at the end of the line to the right (opposite to the Star), a Read More button will appear when you hover over the indicator/script. This link will take you to the script’s publishing page including Release Notes for newer versions. You will always have the newest version automatically.
While we will only be using the Blockcircle Momentum Trading Bot script in this guide, each of the 5 invite only scripts you have been granted access to are described briefly below.
Premium Indicators Summary
Blockcircle Crossover Trading Bot
The Crossover Algorithmic Trading Bot leverages the power of moving averages.
While we will not be focusing on the initial set-up of this Bot in the guide, it is similar to the Momentum Trading Bot to set-up, and once this is complete, you will be able to make comparisons between the performance of the two Trading Bots available to you as a Premium Member of Blockcircle.
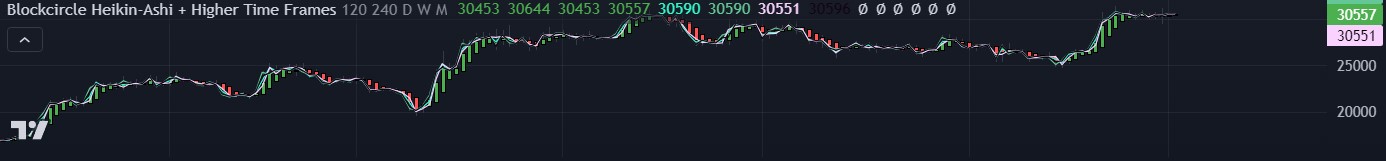
Blockcircle Heikin-Ashi + Higher Time Frames
This is a visual indicator used in human trading analysis, it is not a Bot. The Momentum Trading Bot can be set to utilise this strategy and as such an Indicator is provided for you to gain a better understanding of the strategy.
Adding this indicator will open a pane such as the one below.
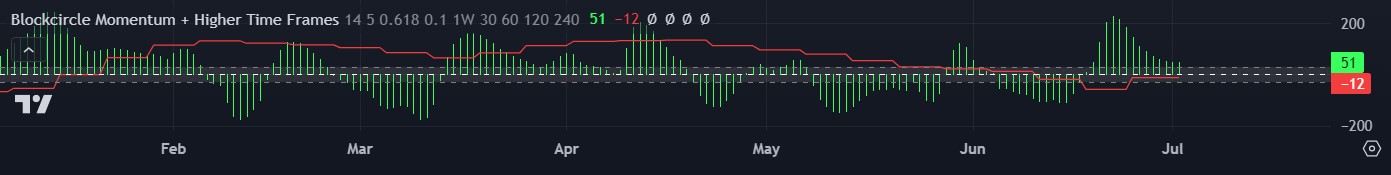
Blockcircle Momentum + Higher Time Frames
Similar to above, this Indicator is not a Bot.
Blockcircle Momentum Trading Bot
The Momentum Trading Bot we are setting up in this guide.
Adding this Trading View Indicator will populate your chart with Short, Long, Stop Loss, arrows and numerical annotations. If it does not, for example there is a red !, skip to the Troubleshooting section before proceeding.
Blockcircle Waveform Bands
“The Bands” is a set of technical indicators brought together into one. These are called Moving Averages (MA) and Exponential Moving Averages (EMA). They help to visualize the changes in price of an asset over time.
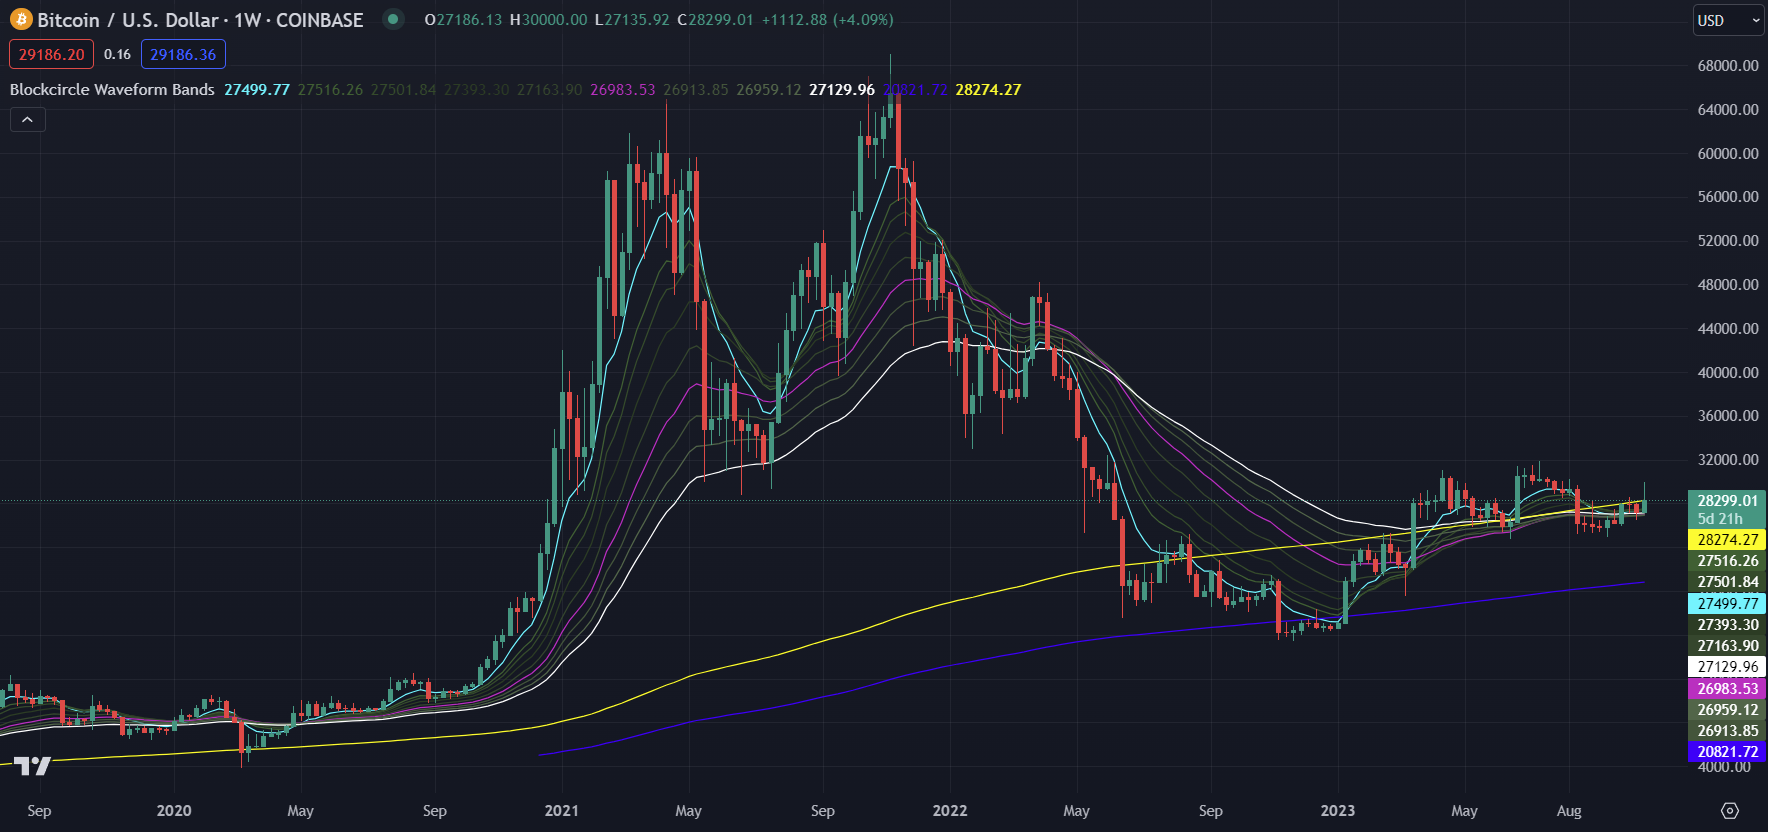
The visual field will be very busy if you are showing the Bot and the Bands at the same time so you may wish to hide the Bands and other Indicators using the icon shaped like an Eye which is next to the Gear icon.
Note: Depending on the indicators you have active, TradingView free account holders may receive a message prompting you to upgrade. You can temporarily close your other indicators to run the Bot, upgrade so that you don’t have to, or you could start a trial TradingView account to see if it is worth it for you.
The Bot only requires a single Trading View Indicator to be showing which is included in a free account. Indicators you close with the X/Remove command will reset to default when you add them back to the Superchart.
Step 2 – Navigation, Features and Definitions
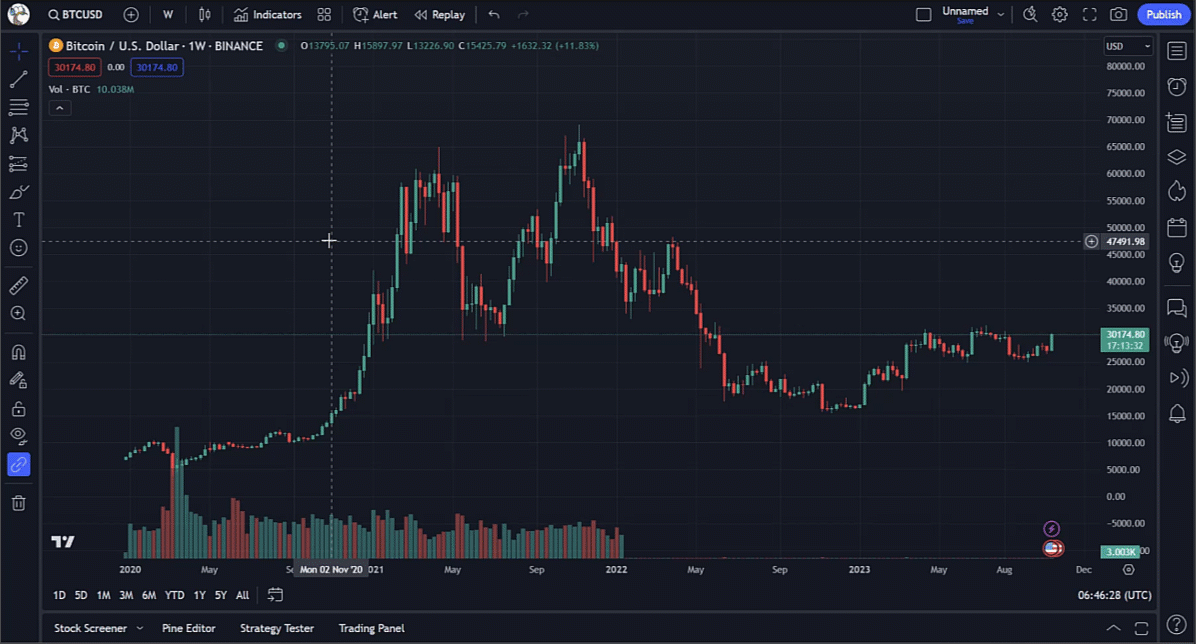
** Quick-Start Summary ** Note that the Bot is displaying the Backtesting results for the default settings and the pair and timeframe you have selected (ie. BTCUSD 1D on Bitstamp in the pic below). Familiarise yourself with the meaning of the symbols on the chart briefly from the list below, these will update automatically when you change the strategy/settings. Open the Strategy Tester pane at the bottom and move to the next step.
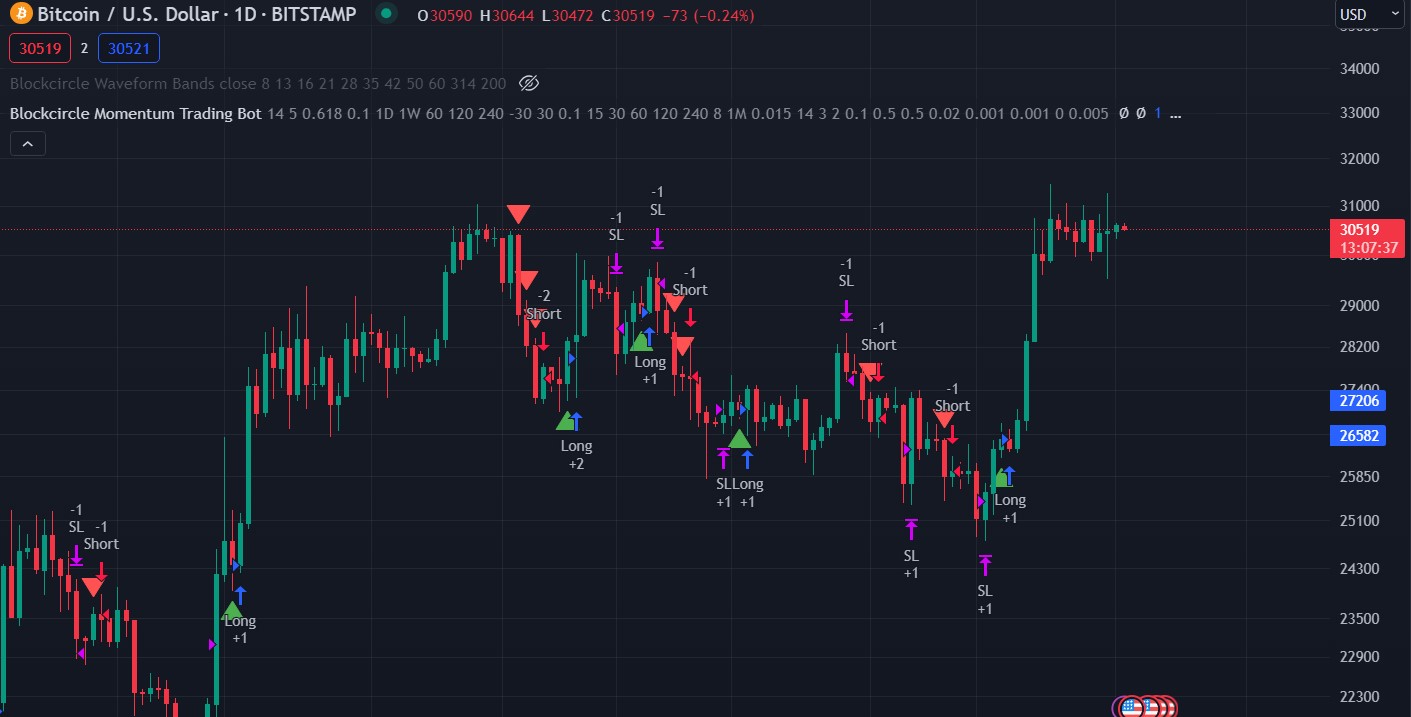
When you first add the Trading View Indicator labelled “Blockcircle Momentum Trading Bot” you should see the following:
While you have just added your Bot and it has not performed any trades on your behalf, the script automatically calculates the trades it would have made had the Bot been running during the default time period. In this way, you can very clearly see the performance of the Trading Bot over the past time period, called Backtesting.
The guide will cover how to view and change the default time period below.
Although Backtesting results are not a promise of future performance, they do tend to show the efficiency of the settings you have entered and allow you to analyse the setup’s performance.
Backtesting is vital and required for you to make your own decisions about your trading configuration and to evaluate your particular settings. Re-calculations are made every time the settings are changed, without the need to restart, so you can try a variety of changes and see if it improves Backtesting performance very easily and reset back to default very easily too.
NOTE: Blockcircle will be updating the default settings over time and changes are automatically published in new versions of the TradingView Indicator. You can reset to default settings at any time at the bottom left of the settings menu. You can view the Release Notes at any time by clicking the Read More button on the right end of the indicator in Invite-only Scripts.
Chart Symbol Definitions
- Status Line – TradingView calls the line showing the Indicator name and values the Status Line, you can see the default settings used by the Trading Bot in this line, 14 5 0.618 0.1 and so on
- Quantity – the numbers on the chart, in the example +2, indicate the Quantity of the asset being traded (also known as the number of contracts). This is the first part of the pair. A positive number indicates a LONG and a negative number indicates a SHORT. For example for BTC/USDT, +2 LONG refers to a trade involving buying 2 Bitcoin tokens or 2 contracts, or for -2 on an ETH/BUSD chart, going short 2 Ethereum tokens or contracts. Quantity does not refer to the USDT or BUSD in these examples
- Long and Short – Indicates the direction of the trade. The Bot can be configured for Long or Short trades only if preferred, the default is both. A trade in either direction is separate, going Short does not just mean closing a Long
- SL – Stop Loss trade. The Bot generated a Stop Loss trade as determined by the Stop Loss settings
-
Thick Red Arrow over candle – this indicates that the Bot has some conditions for a SHORT trade already being met (although not all) and the Bot is much more likely to generate a trade in the next candle. This helps with monitoring
-
Thick Green Arrow over candle – this indicates that the Bot has some conditions for a LONG trade already being met (although not all) and the Bot is much more likely to generate a trade in the next candle. This helps with monitoring
-
Long Arrows – This is a visual indicator that the Bot has calculated and generated a LONG trade order (ie. to buy the first asset in the trading pair such as SOLUSDT, it has generated a trade to by SOL at a specific price during that candle period)
-
Short Arrows – This is a visual indicator that the Bot has calculated and generated a SHORT trade order
-
Stop Loss Arrows – This is a visual indicator that the Bot submitted a Stop Loss trade order
-
Margin Call Arrows –
- The above visual indicators can be configured to your preference, for example if you find the chart too busy with all the numbers AND arrows you can switch off the numbers. This is configured in the Bot settings under the Style tab, more on Settings below
- Strategy Tester – see the next step
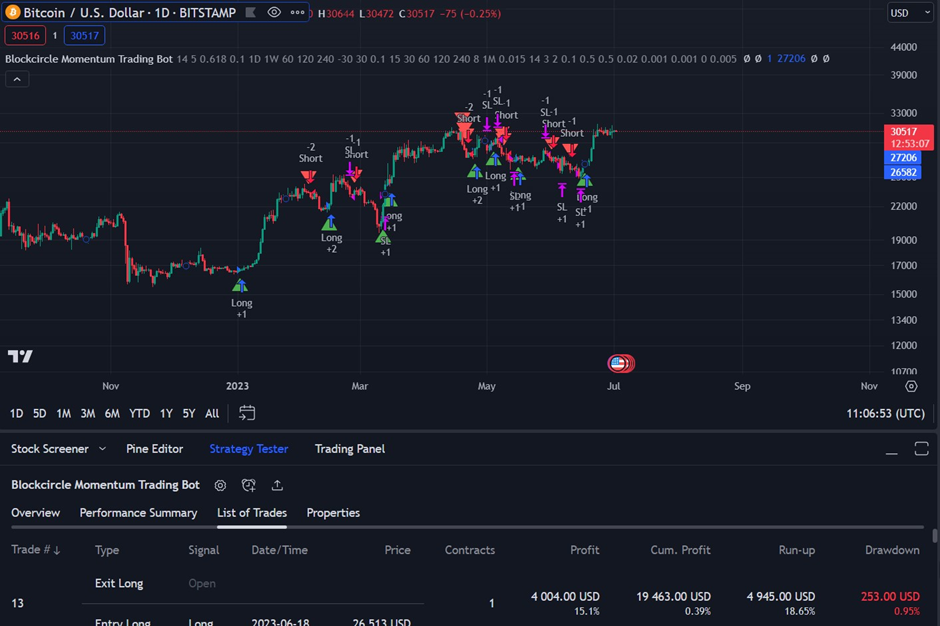
Step 3 – Strategy Tester
** Quick-Start Summary ** Change to the asset/pair you want the Bot to analyse and examine the Strategy Tester -> Overview tab to review a summary of the Backtested performance of the current Bot settings, pair and timeframe selected. You can maximise the lower pane and leave the visual chart hidden for greater field of view.
The Strategy Tester pane allows TradingView Developers to display a range of information to Users from their scripts. Developing the calculations for the summary information can take longer than coding the actual strategy!
You will notice a minimise and maximise button to the top right of the pane selection, and that the pane can be resized so you can see the information better.
Stock Screener, Pine Editor and Trading Panel are not used in this Guide.
It is vital that you access and review the Strategy Tester pane while using the Bot. Blockcircle cannot take responsibility for or manage your settings, capital or trading decisions. The default settings need to be understood and adjusted by you to achieve the results you want. However, Blockcircle is always available to help you with information so you can decide.
Viewing the Strategy Tester
You may be used to prioritising a good view of the chart so you can complete your analysis and develop a trading thesis. However, the Bot is generating the calls now (based on your settings), so it’s more important to understand what the Bot is indicating, as it does not review its own performance and adjust settings to improve, yet
It is completely up to you to monitor and to take responsibility for your capital as this is NOT done for you by Blockcircle.
At least for the moment while continuing this Guide, we would recommend resizing or maximising the Strategy Tester (entire lower pane) and minimising the size of the visual chart.
The Blockcircle Momentum Trading Bot Strategy Tester pane includes:
- Shortcuts to the most used functions – Settings/Configuration (gear icon), Add Alert (alarm clock icon) and Export Data (download icon, eg. for spreadsheet analysis)
- Overview – the top line summarises important information about the performance of the Bot, and equity and drawdown can be plotted on the graph
- Performance Summary – analysis of the List of Trades for easy viewing. It provides a powerful breakdown and analysis of the selected trading period and set-up
- List of Trades – these are the actual trades the Bot makes with the saved settings. This will line up with the annotations on the chart. If you are manually trading, when you receive an Alert you can check the List of Trades to quickly identify what your trade will be
- Properties – an easy way to view the settings you have saved
Basic Performance Monitoring
The Blockcircle Momentum Trading Bot will apply to any chart (pair) that you bring up on the Superchart. So the next step is to set the pair you want to apply it to, such as SOLUSDT, WOOUSDT, RUNEUSDT, DOGEUSDT, RSRUSDT, AUDIOUSDT, KSMUSDT, HBARUSDT, ANTUSDT, DUSKUSDT, etc.
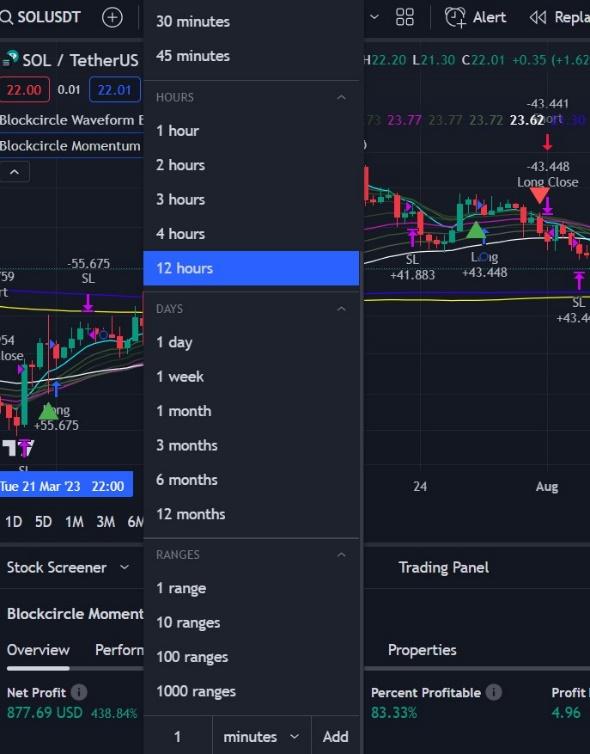
The search bar at the top left on Trading View is called Symbol Search (symbol means the pair or ticker for an asset), click here and select the pair you want the Bot to analyse. You can also set the candle length, ie. 1 day, 12 hours, 4 hours, 1 hour and each will be analysed after 1 or 2 seconds:
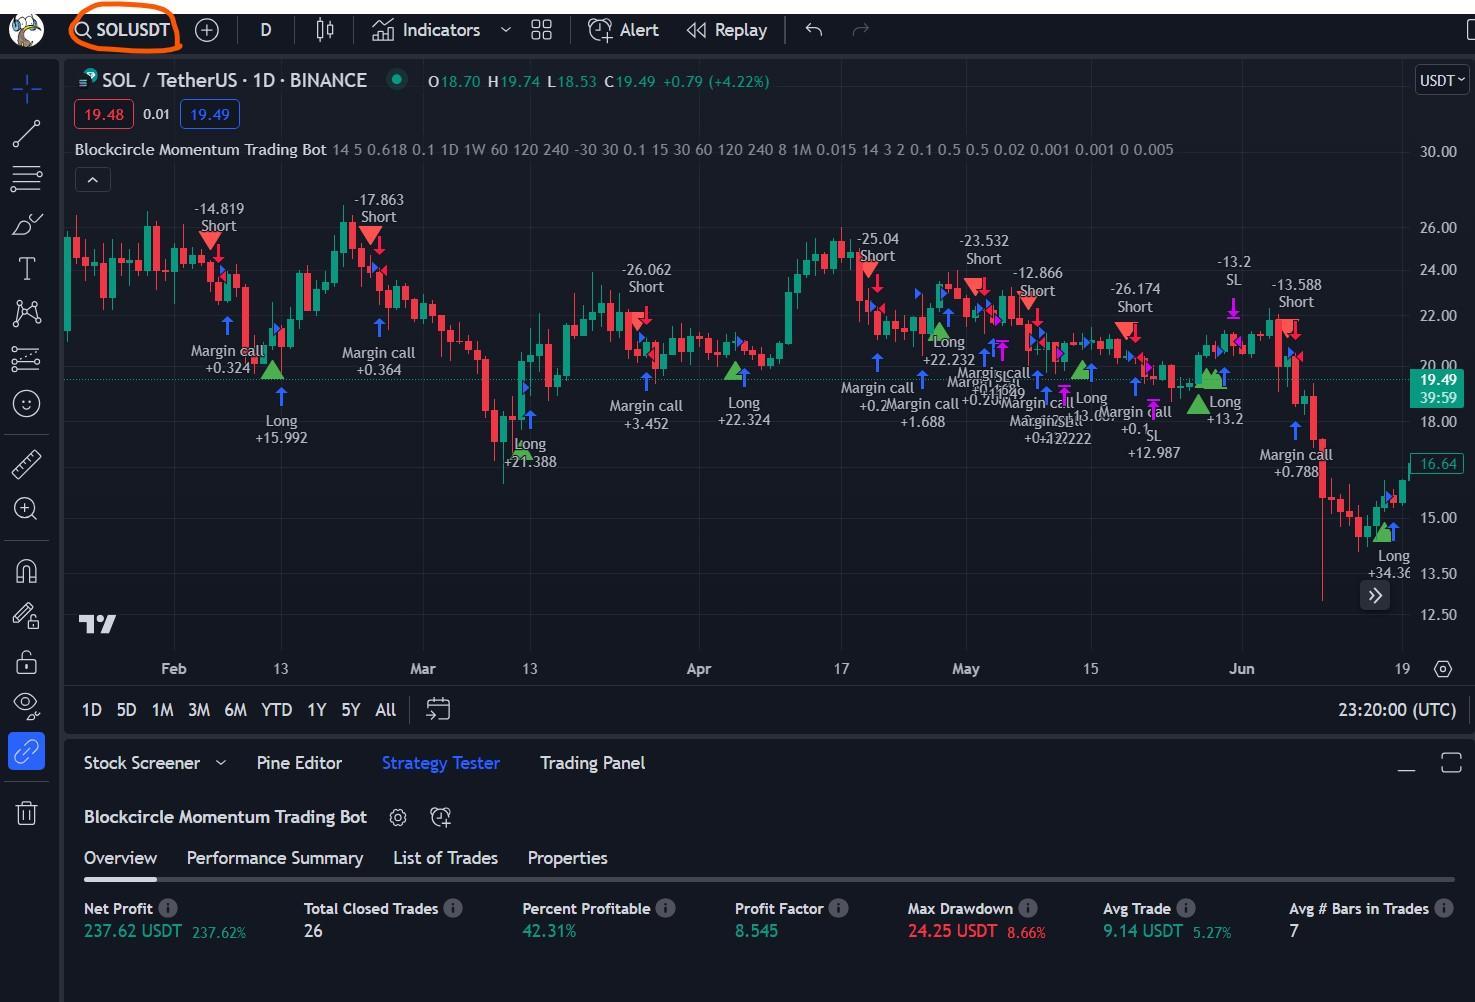
Next, bring up the Overview and review how the Bot has performed on that pair during Backtesting:
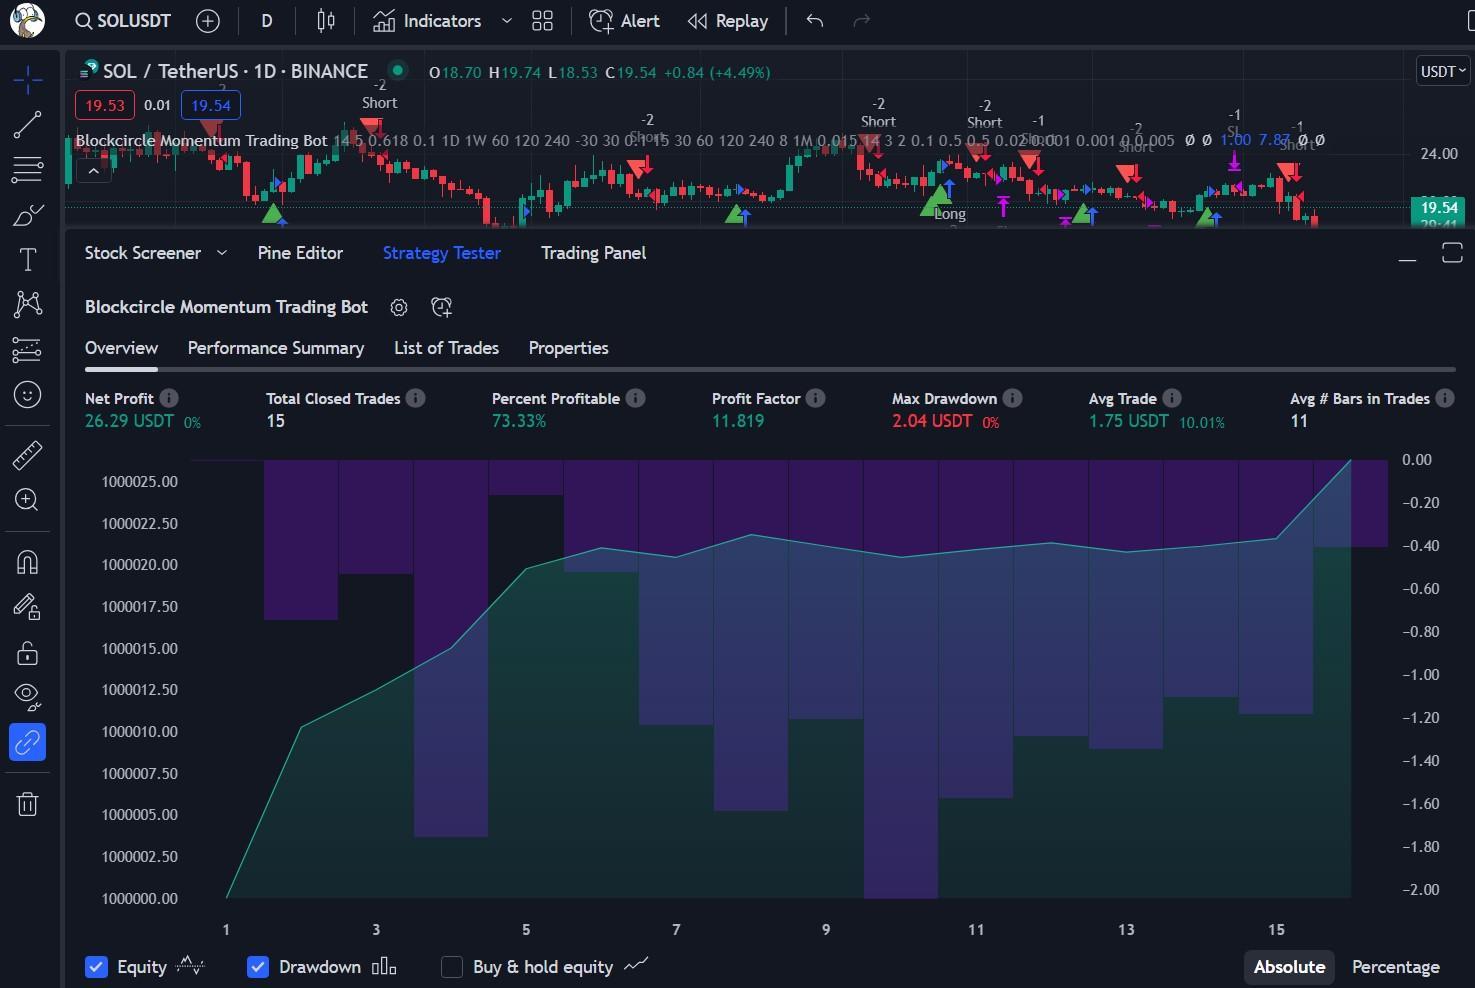
You will likely notice that the performance is not the greatest. This is because we have not yet set the basic trading account settings. In the example above, the Bot is still configured to only allow trading 1 SOL contract/token at a time in the above example. If it were a BTCUSDT chart, 1 contract would be a very different value!
You will be referring back to the Strategy Tester pane on a regular basis as you adjust the settings and monitor the performance of the Bot as new price action unfolds.
Step 4: The Settings
** Quick-Start Summary ** Access and adjust settings of the Indicator/Momentum Trading Bot in each of the 4 tabs as desired.
Adjust your initial capital amount and position size for each trade on the second tab. Tip: a % position will compound your capital whereas an $ amount will not increase automatically. Refine your strategy on the first tab. Visual effects are available on tabs 3 and 4.
All fields of the Bot will update the calculations after 1-2 seconds once you move to the next setting, allowing immediate review of the impact of the changes you enter, refine to your liking. You can review the Strategy Tester -> Overview pane to quickly establish which settings, pairs and timeframes are likely to be profitable. In the next step we will review the Backtesting performance data in more detail.
Next, open the Bot settings using the gear icon or double clicking the Status Line. The first tab is Inputs (see below). There are many settings that are configurable in the first tab including adjusting the trading strategy altogether, however we recommend in this guide starting on tab 2, Properties.
Properties Tab
The Properties tab begins with the first section and includes Initial Capital, Base Currency, Order Size and Pyramiding:
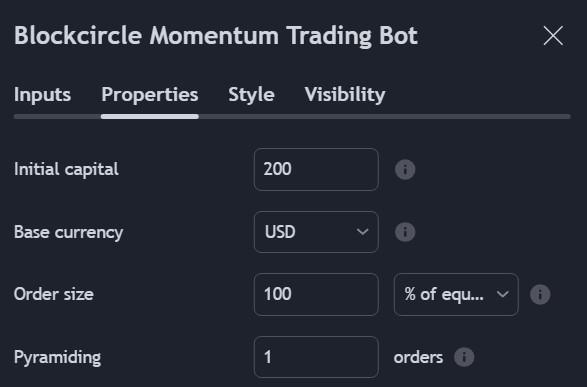
First, set the amount that you want the Bot to trade with, in this example $200 USD. We would recommend only allowing a small amount for any live trading attempts while you are getting familiar with the Bot and ensuring that you are executing the correct trades on your CEX/DEX.
Set the Order Size for each trade. In our example, at 100% of equity this means the Bot will trade the full $200 for the first trade, and then 100% of the capital plus gains or losses in each subsequent trade (eg. if profit is $5 it will trade $205).
This allows for compounding which is very powerful for growing your capital. However, you can set a currency limit or a contracts/quantity limit, for example $10 or 2 contracts, if you want to trade the minimum required on your exchange for a particular pair (check the minimums with your exchange).
Pyramiding is a function used to manage risk and allow a DCA option. It is an advanced function not covered in this guide. We recommend the default of 1 initially.
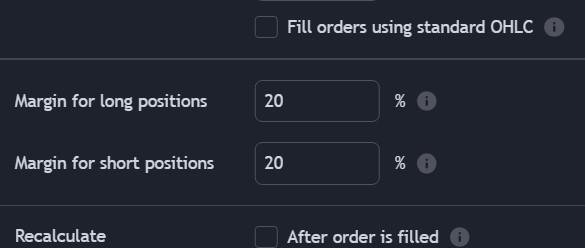
Please also note that shown under the Pyramiding setting is Commission. This setting by default is 0.03%. This refers to the entire cost of each trade, such as fees, lending interest, costs associated with using stablecoins (both trading and usually worth slightly less than USD), and ANY other costs. While these may seem to be small amounts, with compounding and many trades, commission costs can affect the profit you see in your wallet at the end of the day. For the purpose of this guide, we can use the default setting.
In the third pane, we recommend setting Margin to 20%. Again, this would need to be adjusted to compensate during margin trading for advanced set-ups covered in future guides:
Checking the Effect of Settings Changes
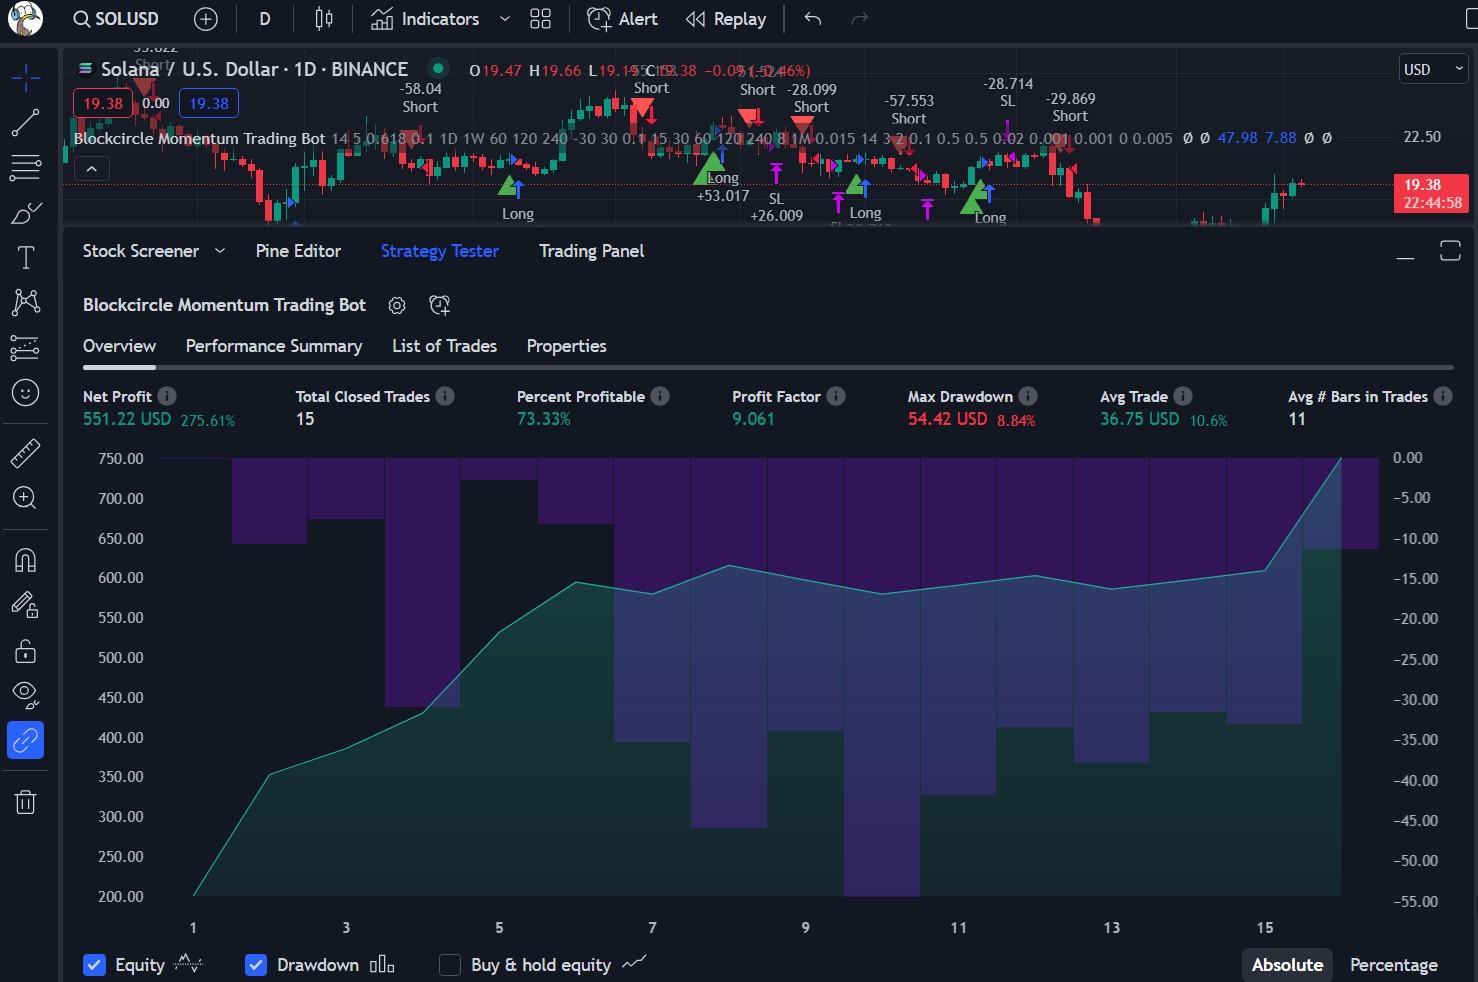
Now when you return to the Overview in the Strategy Tester, the values have updated to reflect the new settings as we adjusted the default setting of $10,000 USD initial capital down to $200, and our $200 has made a Net Profit of $551.22 USD / 275.61% over the default Backtesting period as shown under Overview:
These calculations update in real time so you can adjust the settings more quickly while adjusting the Settings tabs, as you can view the Strategy Tester at the same time to see the impact on performance and the aspect you are trying to improve (eg. net profit, reduced drawdown, increased or decreased trading frequency).
You will need to move back and forth between the Settings and the performance data in the Strategy Tester to choose the settings, pairs and timeframes that you want to trade.
List of Trades, Back Testing and Trade Generation
Please now move to the List of Trades tab on the Strategy Tester. It has also updated:
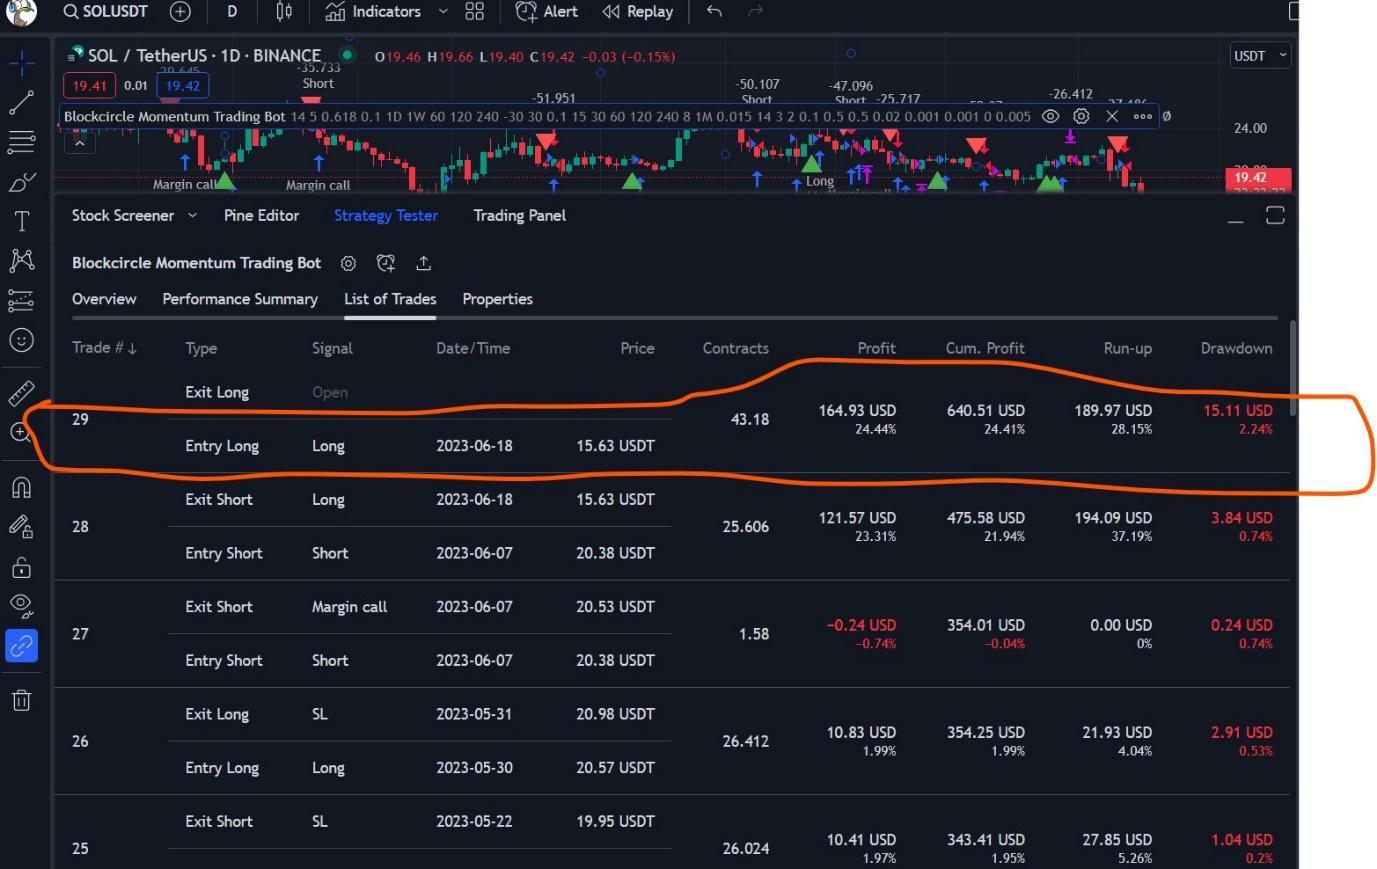
In our example above, most recently the Bot issued a LONG entry, and we are able to identify that it is still Open. In this case the Bot would have opened a LONG trade at a price of $15.63 per SOL. It bought 43.18 contracts or 43.18 SOL tokens. The unrealised profit of this trade currently sits at $164.93. This LONG order worth $674.90 is available a result of our $200 being turned into nearly $700 since 1/1/2023.
It is not recommended to open a LONG trade now to copy this as price has likely changed, wait until the Bot closes this trade and starts a fresh trade, either LONG or SHORT.
Now that you are starting to get familiar with the sections of the Strategy Tester and Settings tabs, we can move on to the parts of the first tab of the Settings that we will be covering in this guide, Inputs.
Inputs Tab
At the top of the Inputs tab, we see the Backtesting calendar range.
The Backtesting date range will set how long the Bot analyses its performance with the historical price data for the selected pair:
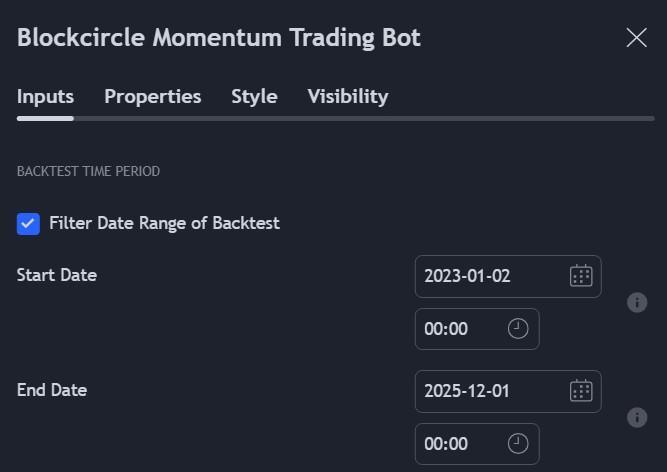
There may be limitations to the time period you can select on a free Trading View account without causing a ! error. If the time period for the selected pair and timeframe exceeds 3000 orders you may receive an error from Trading View that the Bot could not generate the Backtesting results.
You can try a different time period to reduce the Backtesting period. 3000 orders is a lot of activity and plenty enough for Backtesting the Bot, so there’s no disadvantage to free account holders in this regard.
Now scroll to the very bottom of the Inputs tab, you can also enable/disable Longs, Shorts and Limit Orders to match your use case:
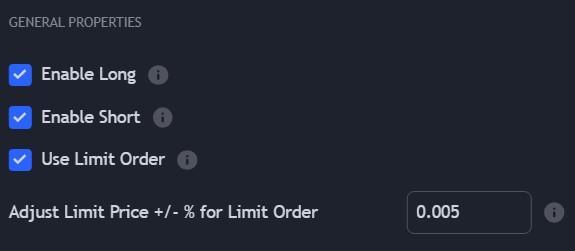
Entry and Exit Conditions will be covered in a future guide.
Exploring the Settings Tabs
At this point, feel free to experiment with the settings, pairs and timeframes and then review the performance outcomes. This will help you to get familiar with the Bot.
You can always reset to default on the Settings tab at the bottom left. Please note this will reset the initial capital, position size and so on as well but it only takes a short time to re-enter this information.
Step 5: Reviewing Performance
** Quick-Start Summary ** In this step you will review all the performance data available in the Strategy Tester pane for your selected strategy before deciding to move forward. Review each tab in turn to establish if it suits your requirements (eg. win/loss ratio, net profit, drawdown, trading frequency, run-up, buy and hold comparison, Sharpe ratio, etc).
Once you have decided on settings, a pair and timeframes, you can use List of Trades as a log of orders that would have been issued during the Backtesting calendar period you selected, and then to view the detail of the trades that are then issued by the Bot in the future so that you can trade manually on your CEX/DEX.
You will set up Trading View Alerts in the next step for manual trading.
Now it’s time to select a pair, timeframe and settings, and to analyse our strategy. For the purpose of this guide, SOLUSDT 12hr has been selected as having solid performance using the default settings at the time of writing this Guide.
Important Notes
Please note that the performance of this pair is not static and may not be reflected on your chart currently. The purpose of this guide is to show you how to setup, monitor and adjust your Bot to account for just such market changes. You can select any pair you wish to complete through this guide.
Please also note that for free Trading View account holders, you may not be able to access the 12hr timeframe as this level of account only includes 4hr and 1D. You should simply use another timeframe for this guide and adding custom timeframes is not necessary.
If you would like to add the 12hr timeframe on a trial or paid Trading View account, you can select this at the bottom of the timeframe dropdown list as shown (1 : minutes : Add):
Summary of Performance Calculations Available for You to Review
Net Profit reflects the realised profit amount and percentage (of initial capital) achieved during the selected Backtesting period using the Settings in the Bot. This amount will change each time you adjust the strategy settings and isn’t linked directly to your account balance in your wallet or on your CEX.
Total Closed Trades is the number of trades completed within the Backtesting period. This assists with analysing the Bot’s performance in terms of how frequently it trades with the selected Settings.
Percent Profitable is the percentage of trades that were closed in profits.
Profit Factor represents gross profits divided by gross losses (for example on trades that were closed in a small loss by a Stop-Loss order).
Drawdown reflects the loss that could have been realised if the Bot closed the trade at the lowest price since the trade was opened. Drawdown is a particularly important performance metric as it indicates how much capital was at risk.
Average Trade is the average profit and loss of all realised trades.
Run-up reflects the maximum profit a trade or average of trades could have made if it had closed the trade at the highest price so far.
The Performance Overview Graph has options for Equity (capital), Drawdown, and Buy & Hold Equity so that you can review each of these values visually. Ideally, a strategy/settings would progressively and consistently increase your equity, while managing a reasonable level of Drawdown, while also beating the Buy and Hold trading approach.
The Sharpe Ratio is a widely used calcuation to compare the return in relation to the amount of risk taken on.
Future Guides will provide detailed guidance on how to interpret and decide upon the Performance monitoring metrics.
Manual Trading
Once you have the Settings and trading strategy that you are comfortable with, you can use the Blockcircle Momentum Trading Bot manually. For Manual Trading, it is easy to set up a variety of useful Alerts in Trading View via the Alerts function. As the List of Trades is updated, you can duplicate those orders on your Trading Exchange and make the trades manually (ie. price and number of tokens/contracts):
Setting up Alerts is covered in the next step.
Automated Trading
Developers can opt to create a Pipedream workflow to utilise the json sent via the TradingView Alerts Webhook function, and then use that generated trade information to communicate with a given Exchange (requires knowledge of your Exchange API protocols, a Pipedream account and paid TradingView subscription).
Blockcircle does not manage the TradingView, Pipedream or Exchange API updates, so please check with these providers for further information.
Step 6 – Setting Alerts
** Quick-start Summary ** Set an Alert using the Condition: Blockcircle Momentum Trading Bot and adjust the message to your liking. Execute the trades on your preferred CEX/DEX.
If you wish to develop a Pipedream workflow to execute trades via your Exchange API, use the Webhook option in TradingView Alerts.
For the purpose of this Guide, we can assume the Bot has the settings we want and we are able to monitor its performance and activity in the Strategy Tester pane.
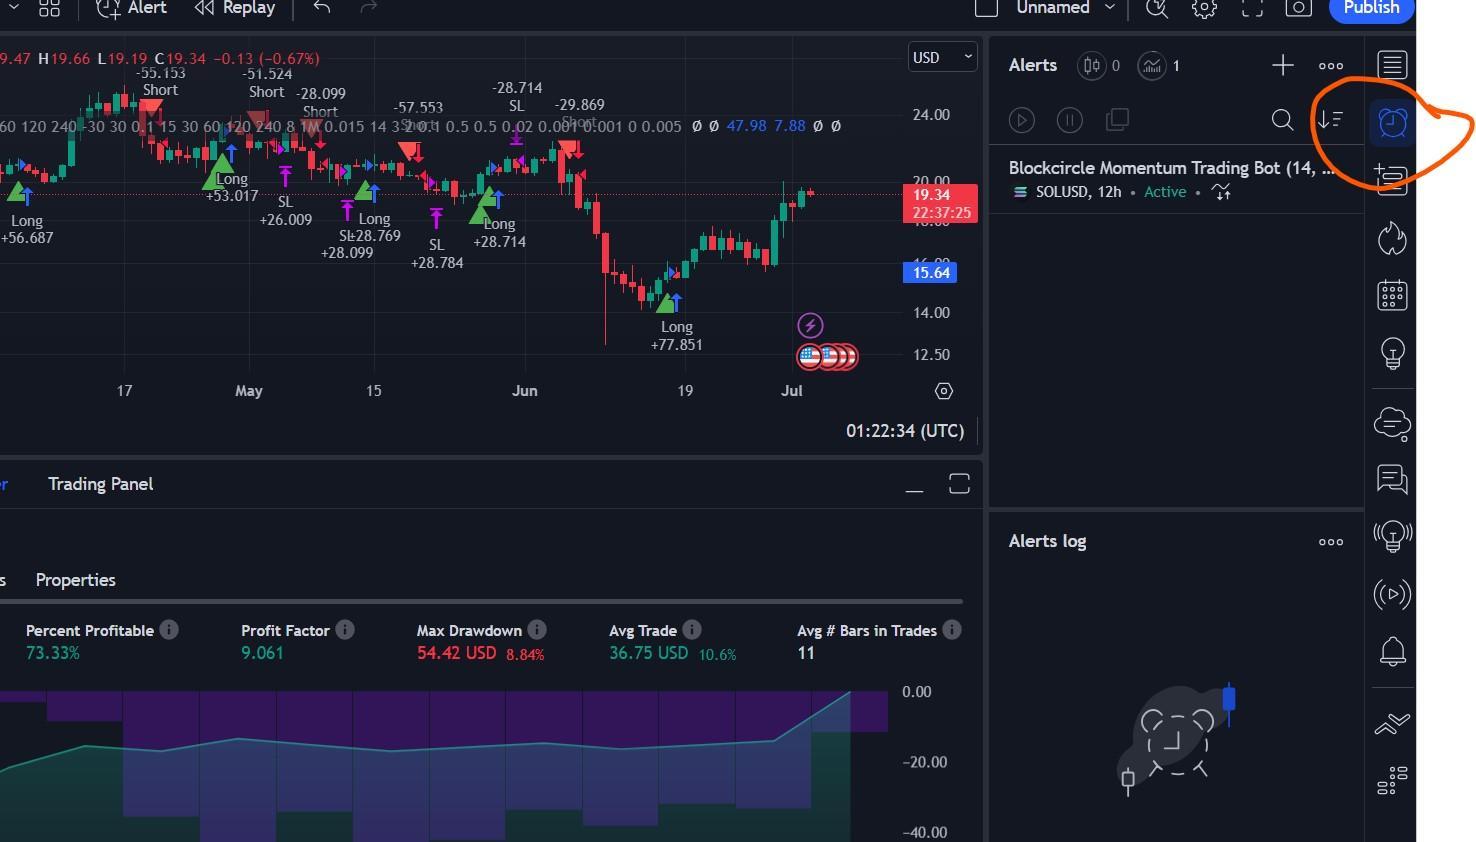
Rather than watching and waiting for trades to be generated, we can easily and simply set an Alert to notify us when the Momentum Trading Bot generates or closes a trade.
Clicking on the Add Alert button, brings up this dialog box:
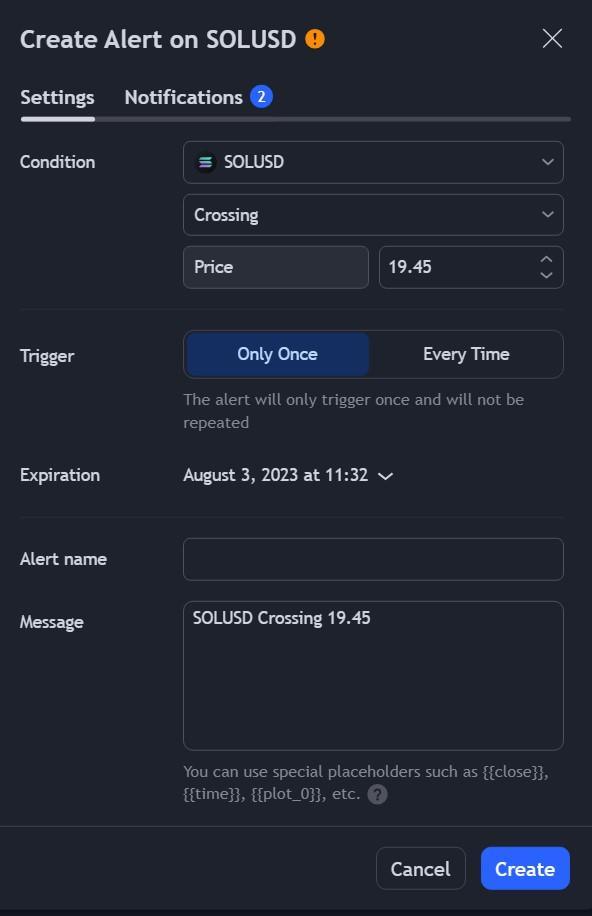
First up, we need to change the Condition field to Blockcircle Momentum Trading Bot.
Note: Alerts only stay active for 2 months on the Free, Pro and Pro+ Trading View accounts. To allow Alerts to stay active indefinitely requires the expensive, Premium level account. Be sure to reminder yourself to review and renew the Alerts at the end of the expiry.
In the Message field, the Bot displays its instructions in json format. Think of the message field as a note you could make to yourself in response to a trade being generated. So if your trading strategy condition gets triggered, you can remind yourself what the meaning of the Alert is.
The Notifications tab allows us to select different options for what the Alert does:
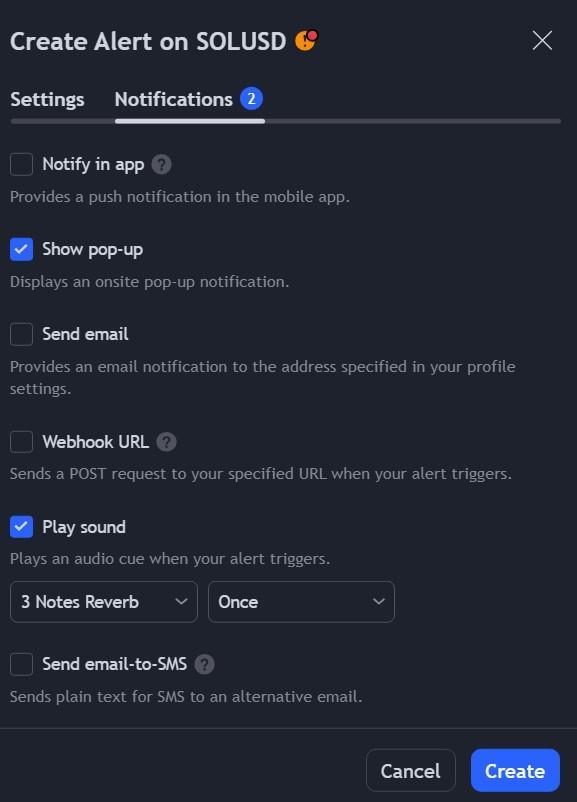
You can configure your preferred method of being alerted to a Bot trade, then review the List of Trades to duplicate it onto your exchange to make the trade order.
Summary
This guide has covered the steps needed to begin using the Blockcircle Momentum Trading Bot offered to Premium Members.
Once you have completed these steps, you have the Bot running on your Trading View account and will be able to manually trade on your exchange.
You can Backtest and monitor the performance of the Bot on any chart and determine the profits made during any time period (even if you want to get nostalgic).
While it may have seemed a bit complicated at first, you should not need to spend a lot of time adjusting the functions described in this guide in the future, unless you want to use the advanced features available with the Bot.
This guide will be adjusted with fresh links as further guides are published.
All currently available Guides for TradingView are Here