


Since 2017, CryptoHunter and Basel have regularly used a combination of particular Exponential Moving Averages (EMA) and Simple Moving Averages (SMA or MA) indicators to demonstrate the technical analysis of charted data about a given cryptocurrency, including Bitcoin and Ethereum.
Blockcircle members requested a way to add these EMA and MA indicators to their own TradingView accounts, and the Blockcircle Waveform Bands Custom Technical Indicator was created to add to the suite of custom technical tools.
If that doesn’t make sense to you yet, that’s ok! That’s what these guides are all about.
In this 3 part series you will follow along and learn how to:
Part 1: Find the Blockcircle Waveform Bands
Part 2: Identify the Blockcircle Waveform Bands
Part 3: Use the Blockcircle Waveform Bands to add to your own technical analysis techniques.
How to Find and Add the Blockcircle Custom Technical Indicators
Step 1
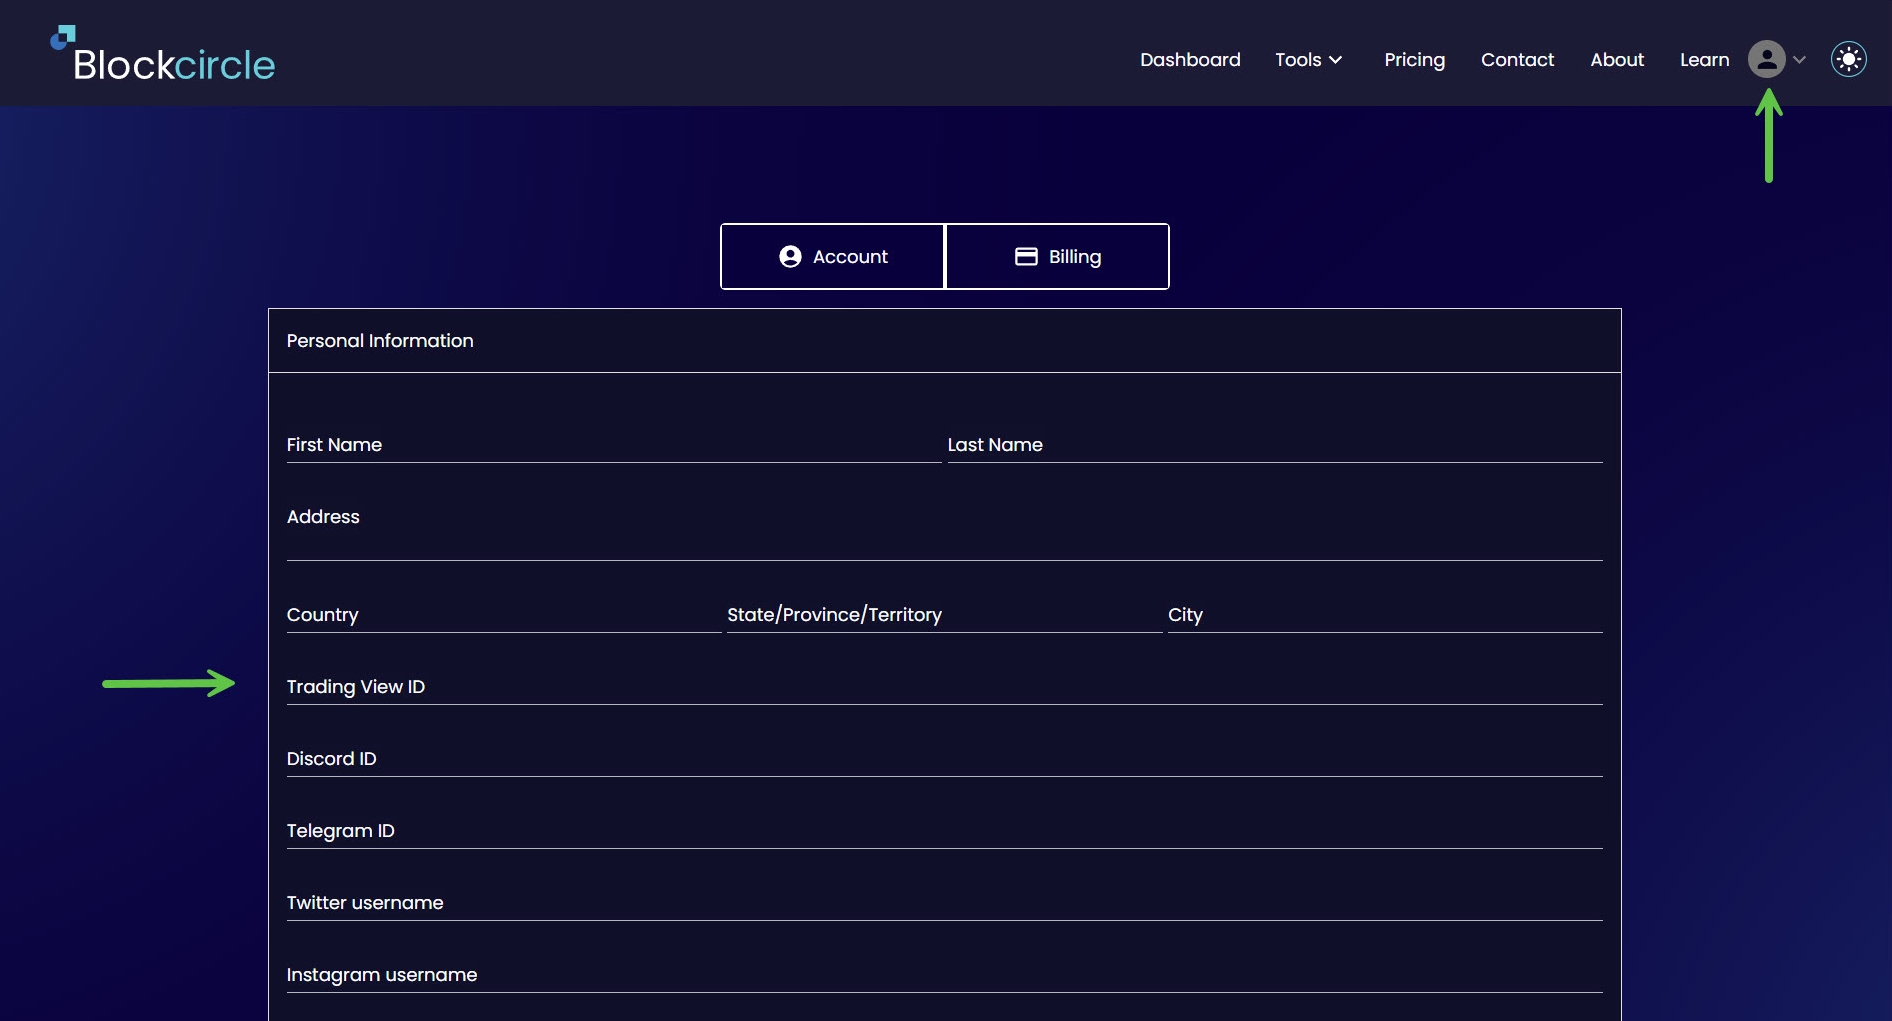
To use the Blockcircle Custom Technical Indicators you will need to use a TradingView account and enter that Username into your Account.
Step 2
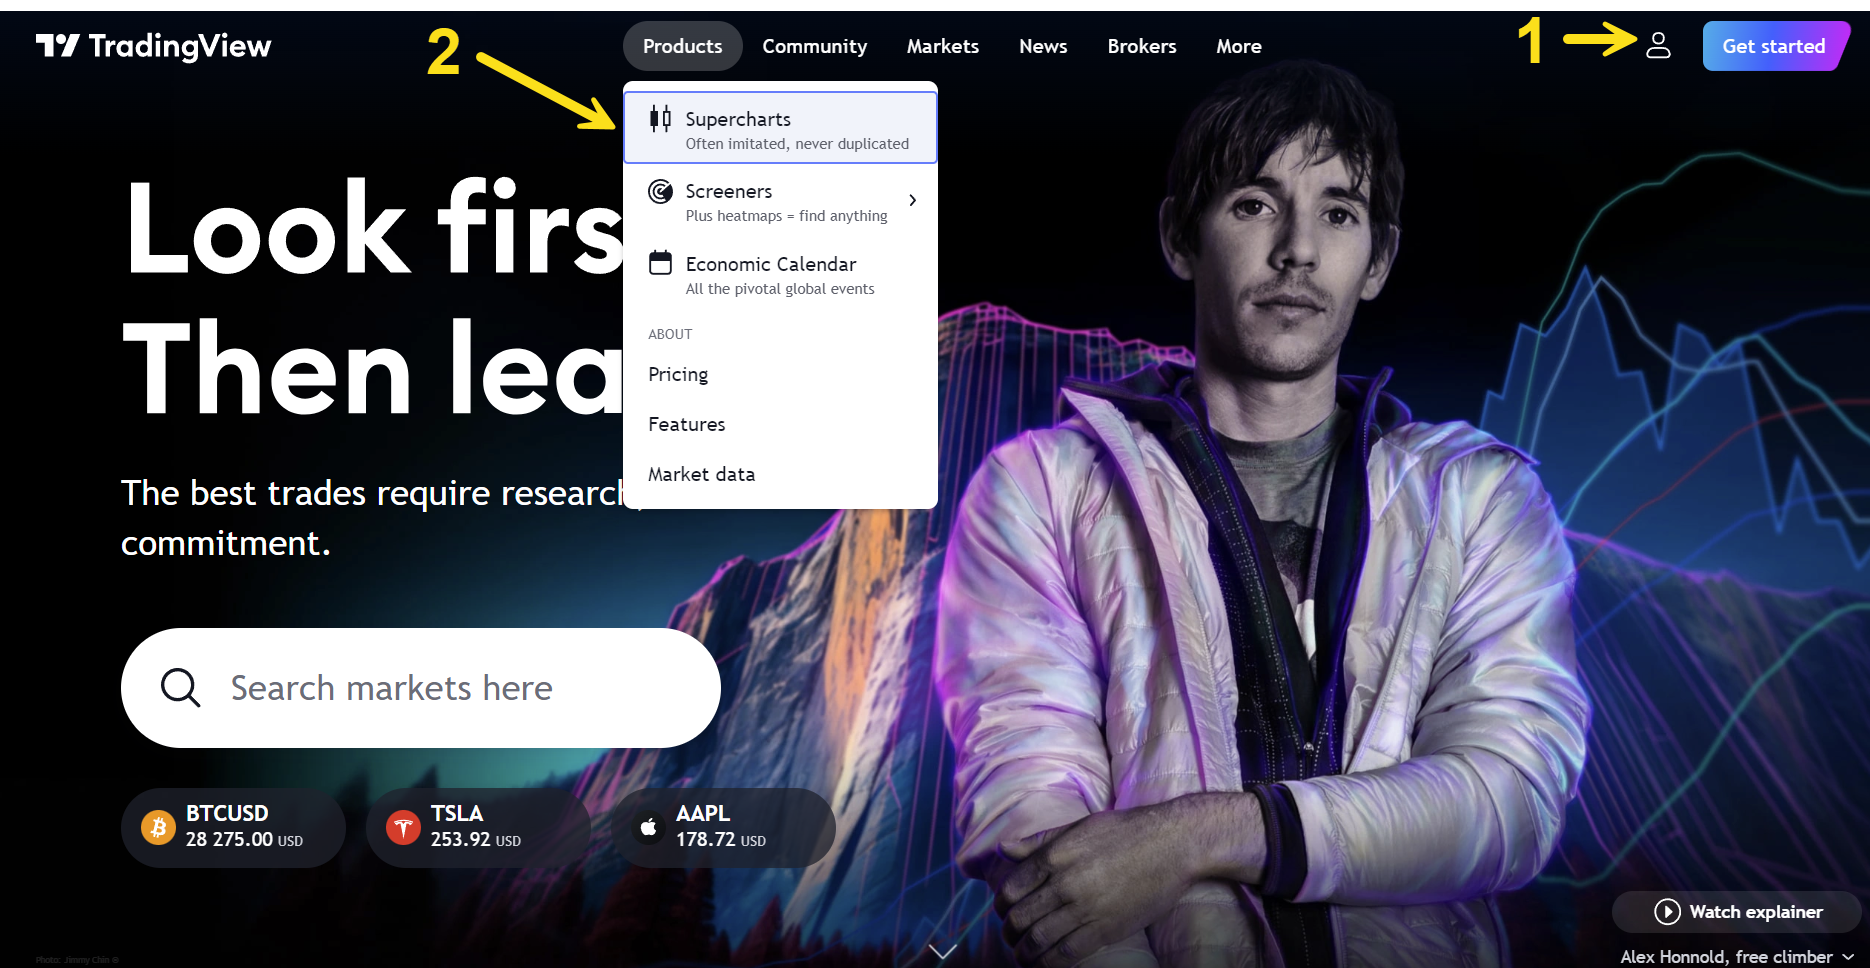
Navigate to www.tradingview.com, Log In and open a Superchart.
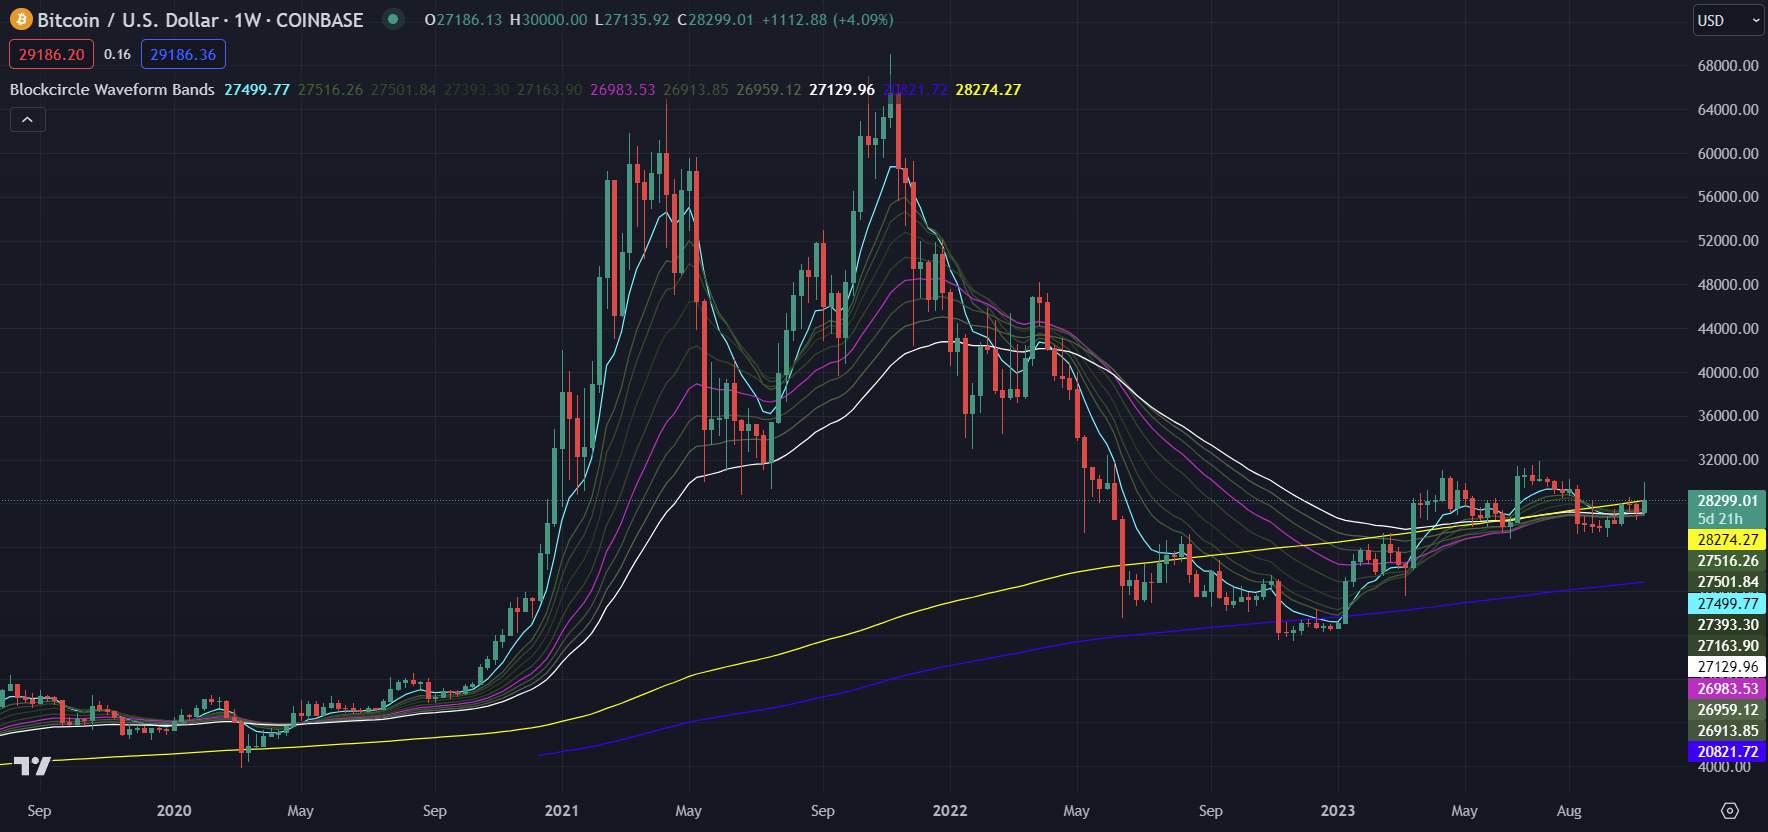
For this guide, we will be using the BTCUSD 1 week Binance pair. This video will show you how to view this chart on www.tradingview.com.
Step 3
Next we will navigate to the Indicators button, and then to Invite-Only Scripts. Here you will see the suite of Blockcircle Custom Technical Indicators available to you.
As shown above, we can add the Blockcircle Waveform Bands indicator by left-clicking and this advanced tool will be added to the center charting area. You can also add it to your Favorites by clicking the Star, and there are also Release Notes via the Read More option.
You may have also noticed that you have access to more Blockcircle Custom Indicators. These are listed as being published by Blockcircle Founder, Basel Ismail, bismal.
Below is an outline of the current Custom Technical Indicators available with links to guides on how to use them:
- Blockcircle Crossover Trading Bot – an algorithmic trading bot that uses moving average crossovers to generate precise trading signals.
- Blockcircle Heikin-Ashi + Higher Timeframes – the Heikin-Ashi candle type paired with higher timeframe calculations helps to filter out market noise and present smoother trends for members to research and predict price trends.
- Blockcircle Momentum + Higher Timeframes – a custom version of the CCI and the T3 moving average for smoothing and generating signals plus more.
- Blockcircle Momentum Trading Bot [full guide available soon!] – a full product suite of bots allowing you to backtest and simulate millions of permutations of different trading strategies.
- Blockcircle Waveform Bands – the topic of this guide, keeping reading below.
Step 4
In this step, we will find out how to manage the Waveform Bands Indicator. Next to the Custom Indicator title on the top left of the chart, Blockcircle Waveform Bands, we can see Hide, Settings, Remove and More icons as shown below.
Hide/Show allows us to temporarily hide the Bands from the chart. Using Settings will be covered in Part 2 of this guide. We can also Remove the Indicator with the X, and access More general Indicator settings. You can see that when we remove the Indicator, it is easy to find because we clicked the Star icon previously, so the Bands has been added to our Favorite list.
Summary
You have now found out how to add the Blockcircle Custom Technical Indicators and ou should be ready to use the Blockcircle Waveform Bands. You can find detailed descriptions of each Blockcircle Custom Technical Indicator via the links above, or simply add them to your chart and begin to explore.
Please now continue to Part 2: How to Identify the Bands.