

Having a crypto portfolio tracker can be very useful if you’re investing in crypto for the long-term. A crypto portfolio tracker has a number of benefits. For starters, it makes managing a portfolio easier by putting all records of your cryptocurrency holdings on one easily accessible platform. A centralized view lets you quickly see how much their portfolio is worth, keep an eye on the performance of each asset, and decide how to allocate your money for the next round of funding.
A crypto portfolio tracker can also help with tax reporting by making it easier to figure out whether you made or lost money on your cryptocurrency holdings. It makes following tax rules easier by creating transaction reports and summarizing investment data. Trackers like these also make it easier to look at performance over time, which lets you see how well their strategies are working. This information about the past can help you decide whether to keep holding certain cryptocurrencies, sell them, or buy more of them.
How to build a portfolio tracker using Google Sheets
Google Sheets is a free online spreadsheet management software that is available to use provided that you have a Google Account.
It’s similar to MS Excel, but it’s free to use without any special licensing to worry about, and it comes with a few perks too, such as the API Connector extension, which we’ll play around with. Before we start, let’s review the benefits and drawbacks of what we’ll be building:
The benefits:
- It’s free. Enough said.
- Open on any device. You can download Google Sheets on Android and iOS.
- Can be used to organize your investments. You can build it as you like, customizing it with any labeling system as you please.
The drawbacks:
- Can’t be used for live trading. Although we’ll connect our spreadsheet with an external data provider, we must refresh the data manually each time we want fresher data.
- Steep learning curve for those who are inexperienced with Google Sheets.
- Transactions must be added manually, and you need to make sure to enter the right data carefully to stay accurate.
Steps to build a crypto portfolio tracker with Google Sheets
1. Create the pages
On a fresh Google Sheet file, create 2 pages and label them as such: Transactions and Price Data.
2. Add transaction meta-data
On the Transactions page, on the very first row, add the following columns: Date, Action, From, To, Price, Quantity, and USD Value.
If your day-to-day currency is not USD, you can use some other currency. This column is meant to measure your crypto wealth denominated in the currency you’re reporting with.
3. Fill each row with a transaction involving one asset
For testing purposes, let’s add a few fictitious transactions. Let’s use an instance where you’re swapping ETH for AAVE. Let’s say you’re using USD as your local currency.
The transaction above will take two rows. One row is for ETH, and the second row is for AAVE. Even though you are not selling ETH directly to US dollar bills, you are effectively “cashing out” ETH. The dollar value of that transaction must be recorded. So, you must put ETH under From and leave a blank cell under To, and type in “sell” under Action.
Similarly for the row that describes buying AAVE, you must put AAVE under To and leave a blank cell under From, and type in “buy” under Action. Here is an instance.
![]()
Note: The Price column will be dynamic, which will contain data provided by the API Connector.
4. Add a summary next to the transactions list
The summary will calculate how much of each asset you have accumulated based on the transactions. For example, the first row of the summary tracks your ETH quantity. It sums all the values under Quantity in rows where ETH is under the To column, and subtracts by that in rows where ETH is under the From column.
The other columns use the same principle to track the following for each asset — Ticker, Price Invested, Quantity, Market Value, PNL. Here is an explanation of what each column does:
- Ticker – identifies the individual asset you’re invested in.
- Price – the (constantly updated) price of the asset you’re invested in, which is often quoted in USD.
- Invested – the dollar value (or whatever currency you’re working with) of the asset.
- Quantity – the total unit accumulated for the asset you’re invested in.
- Market Value – how much your asset is worth if all of it were sold in the market at once.
- PNL — which stands for Profit and Loss, is the amount of extra monetary value you’re gaining / losing by holding onto the asset.
An example of a summary is shown here:
![]()
Note that for ETH and DAI, the invested amount of money is negative because we started the trade history with a sell action. Because a negative investment value or quantity produces no meaningful data, it is ignored.
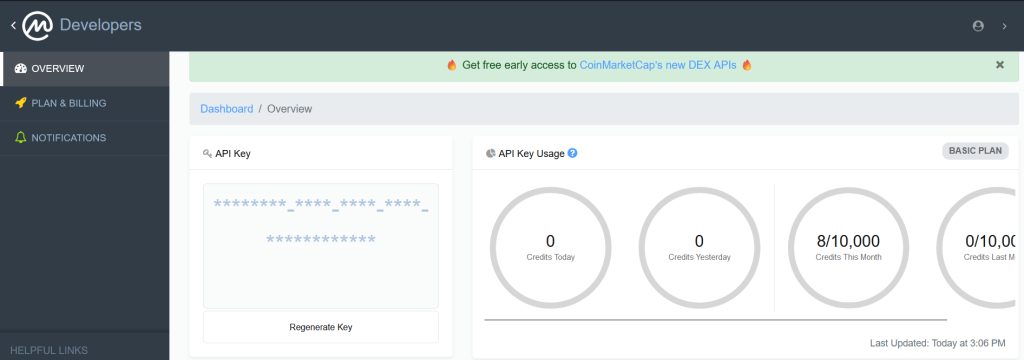
5. Connect to a CoinMarketCap Price API
Sign up to CoinMarketCap if you haven’t, and get your free API key. You should see this window, and keep this window open. Click on Generate Key only when you’re ready after the next few steps.
Then, go back to your Google Sheets and open your Price Data page. The raw pricing data will be posted here and will not disturb your other pages.
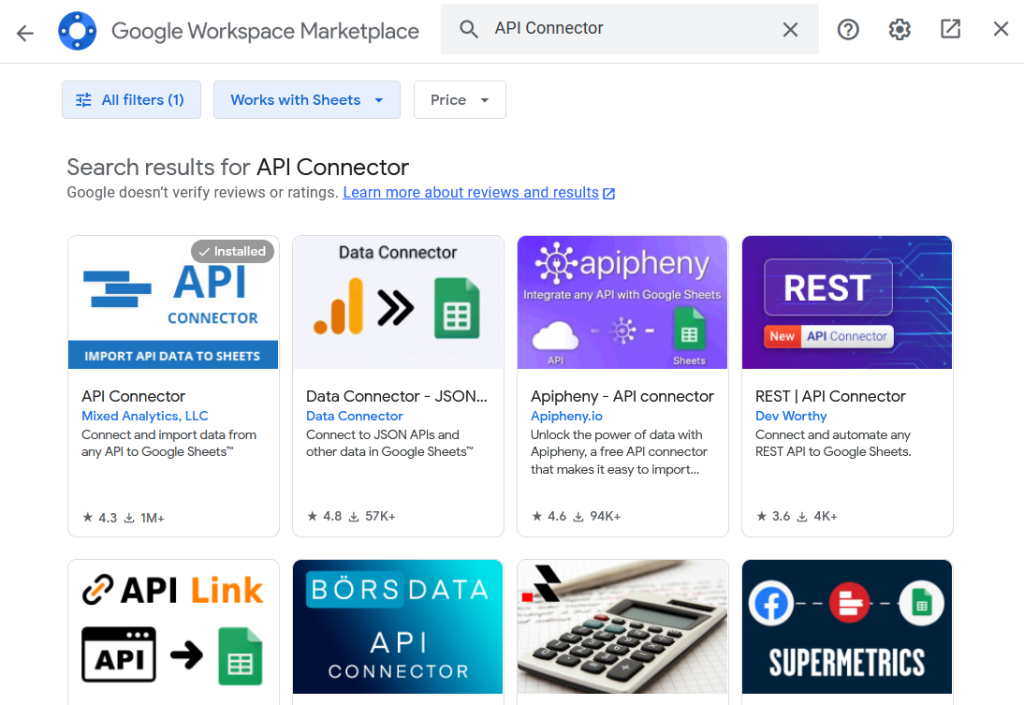
Check the toolbar above, and go to Extensions > Add-ons > Get add-ons. You should see this Google Workshop Marketplace window. On the search bar, type “API Connector” and click on the extension provided by Mixed Analytics, LLC.
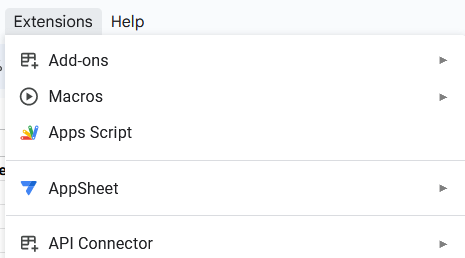
Once you’ve downloaded the extension, go back to Extensions and you should see API Connector as one of the options. Then, click Open. You should see this window pop up on the side.
Click on Create request. Thenn, under Configure API Request, there should be a search interface. Click on it, and type “CoinMarketCap”. Under Authorization, paste in your API key from CoinMarketCap.
Under Endpoint, you should select “v1/cryptocurrency/listings/latest”. This endpoint will serve you price data (among other things) of 1000 coins in the order of their market cap. If you’re invested in popular cryptocurrencies, you should be able to get their data within the top 200 – 500 coins by their order (which is based on their market cap).
Find the appropriate range, and then scroll down to find the limit parameter. Type in “200” or whatever value you think is appropriate for your range.
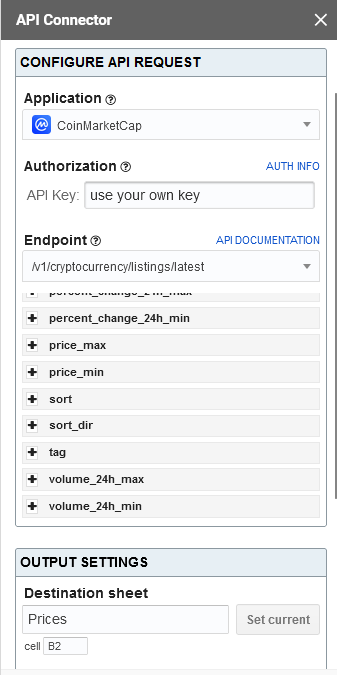
Under the Output Settings, click Set current so that the results will be populated into the Price Data sheet. Select A1 as your left-most cell. Name your API request, click Save, and then Run.
You’ll see a bunch of data coming in from CoinMarketCap at that instance. If you hit Run again, you’ll retrieve the latest data. Since you’re using the free tier API key, you’ll get 10,000 refreshes every month. But this should be plentiful for use even on an hourly basis.
6. Reference the prices on the Transactions page
Use the Index-Match combination formula shown above to index the prices from the Price Data page to the Transactions page for the appropriate asset. You’d also want to create price references for each row in the transaction record.
![]()
7. Populate your portfolio with real transactions data
Once you’re satisfied with your crypto portfolio settings, it’s time to populate your transactions ledger with real data. Simply create a reference of this Price sheet on columns where the prices should stay consistently updated.
Trade confidently with Blockcircle
With Blockcircle, you can track the prices of hundreds of crypto, from the most popular like Bitcoin to the more niche and exotic. On your own personal Dashboard, you can drag and drop whatever data monitor you’d like and compare them against other data monitors for a more thorough analysis.
![]()
For example, you might be interested in the correlation between the price of Bitcoin and the derivatives market activity for Ethereum. You can simply click on [+ Add] and choose the pieces of data that you’d like to see on your personal Dashboard. It’s that simple.
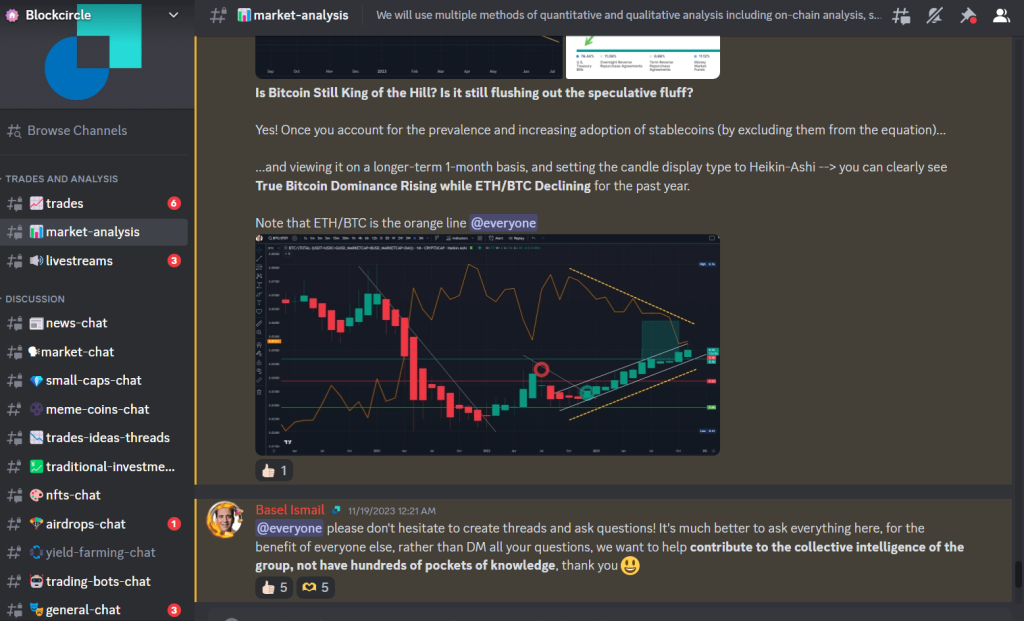
Don’t forget to join our exclusive Discord server where our crypto hunters and our active community of traders from all levels of experience come together to discuss the next big moves. Our most preferred trading strategy is momentum trading, to get the maximum result in one go with the right amount of effort and analysis.