


In our previous article, we talk about crypto investment risk management using the relative price performance as a factor to consider the size of various crypto assets in your portfolio. We also take a look at how the rebalancing strategy can help you accumulate more profit as you buy and sell at various points in the market.
In this article, we now talk about crypto investment strategy and risk management by looking at a similar strategy to rebalancing, which involves the use of technical indicators. This strategy allows you to time your buying and selling by certain market conditions.
Simply, during a bear market, you’re buying; during the bull market, you’re selling. You’re also buying and selling at different amounts based on perceived risk associated with technical indicators. Want to learn the details? Continue reading.
Risk management using moving averages
This strategy uses the simple moving average indicator. This is a trend indicator, and prices tend to converge around the moving average line when the trend is moderately strong. We’re going to use this fact to make two decisions — Do we buy or sell, and how much?
Take a look at the price chart below. Do you notice how the price crosses up and down the 10-period SMA? If the SMA is over the price line, the trend is moving downward, so would you want to buy and accumulate more crypto at this time period? And if the SMA is under the price line, the trend is moving upward, so would you want to sell and generate crypto profits?
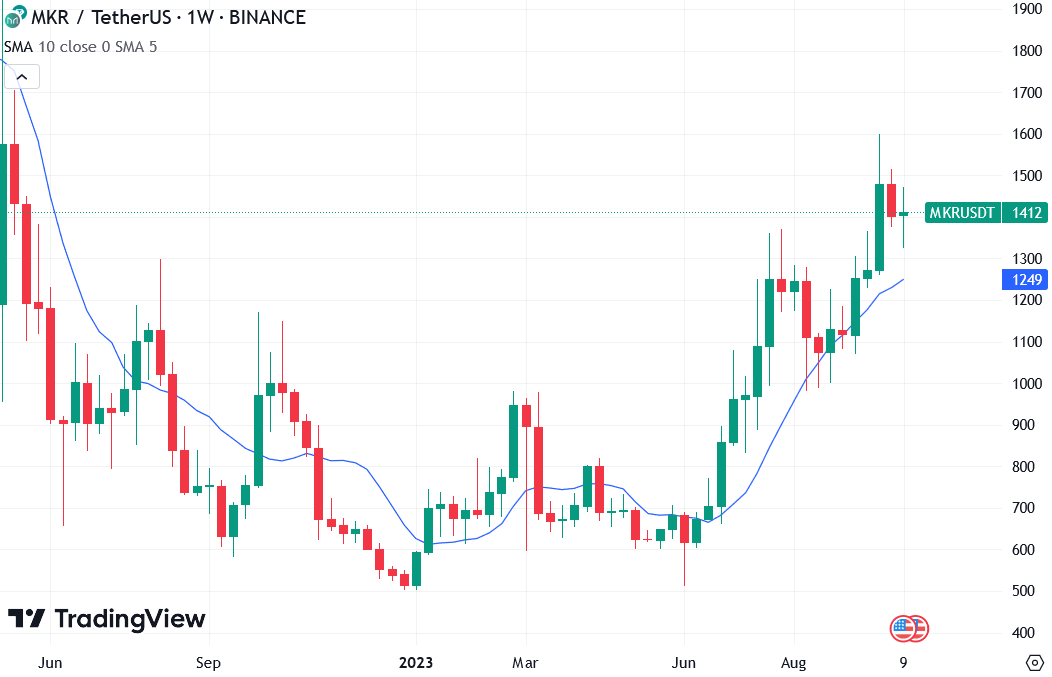
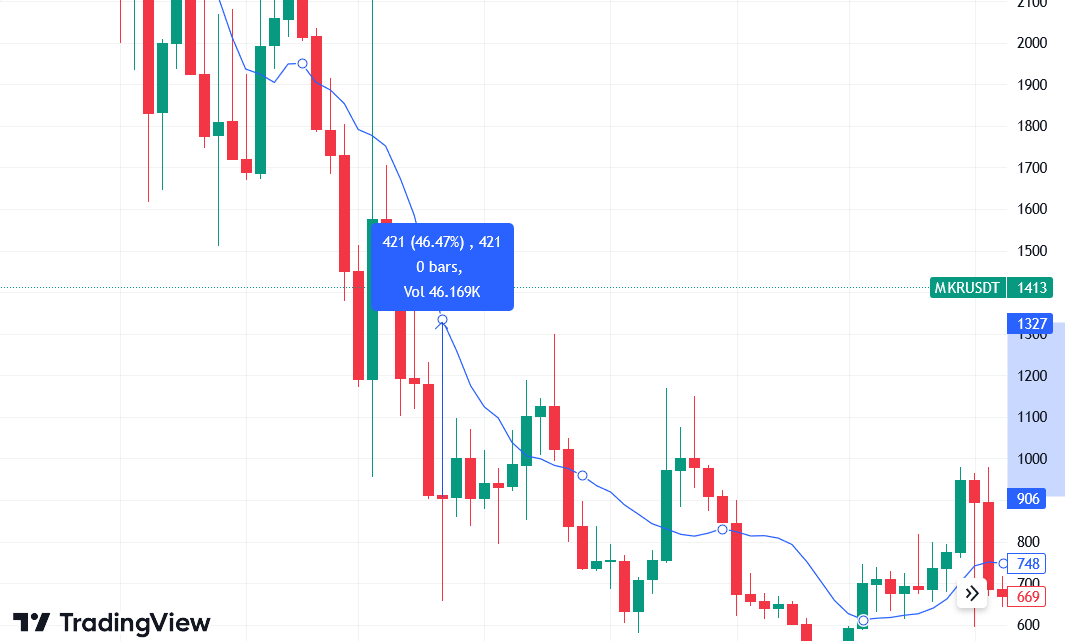
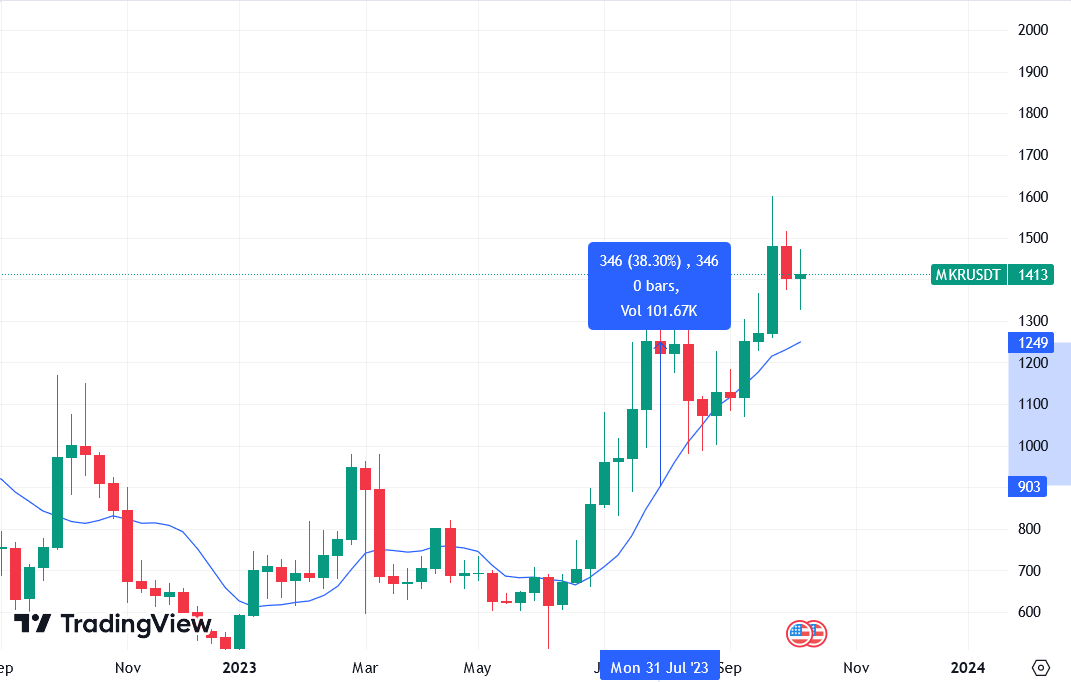
Now, also notice how the distance between the price line and the SMA line is ever-changing. At one point, the price drops quite suddenly, putting a great distance between the price line and the SMA line.
During a bear market time, would you want to buy more crypto? Conversely, as the price line moves closer up to the SMA line, would you want to buy less crypto, because it becomes more risky as the price could go down further? When it’s time to trade the bull market, you’d want to sell more crypto when the price line is furthest away from the SMA line to maximize your profits.
Using just one moving average, you can figure out what to do (buy or sell) and how much to buy or sell by looking at both the trend and distance of the SMA relative to the price line.
Decide your baseline buy/sell amount
In US dollar terms (or whatever currency you’re using for crypto investment), decide on your “baseline” amount of money. This is the smallest amount of money you could use to buy or sell crypto when the price line is very close to the SMA line. Let’s say our baseline is $100 per week.
The next step is to decide your maximum spend. You could set an arbitrary amount, say 1.5x or 2.5x your baseline. The greater your maximum spend, the higher your potential for profit, but the greater your risk of running out of liquidity to keep buying at low prices.
If your investment budget is $10,000, and you set your maximum spend to be $250, and you happen to invest when asset prices are collapsing in an extreme bear market, the worst case scenario is that your budget would last around 40 to 50 weeks.
In terms of the crypto market, this is actually enough runway for the market to recover to more favorable pricings. Also, please note that although prices won’t always recover to its previous all-time high, your investment would still turn a profit because you’d be investing in cheaper crypto assets during the time you’re “waiting” for the bull market return.
Decide on the maximum “distance” for your maximum spend / sell
Crypto prices could rise and fall at varying degrees of percentages, typically at 30%. If your maximum distance is greater, say at 60%, you’d be spending $250 when the asset price is 60% below the SMA line. If you set this number too large, you’d be under-investing and you will hold too much cash that isn’t working. Arguably, it’s less risky, but anything with less risk will not yield more return in investment.
If you set this number too low, say 5%, you’d be hitting your spend limit each time your price is 5% below your SMA line, which can happen frequently in the crypto market. You’d also likely to overspend on crypto that are not at a discount, which decreases your overall profitability.
Time to do some math
Once you’re set on the numbers for your 1) baseline spend, 2) maximum spend, and 3) maximum distance, you’ll do a simple mathematical operation before you place an order, and you need to do this regularly just like you would do any other regular investment strategies, like Dollar Cost Averaging.
The amount to buy or sell =
( distance between SMA and price line (%) x custom multiplier + 1 ) x baseline spend
The custom multiplier is something you need to find yourself. It’s easy — first input the variables for when the amount to buy/sell is 2.5x the baseline (you can use a different max spend multiplier). For example,
$20 = (30% x custom multiplier + 1) x $8 (in case of 2.5x the baseline)
custom multiplier = ( $20 / $8 – 1 ) / 30% = 5
Great, so now that you know the custom multiplier, you can input the variables in an Excel spreadsheet to automate your calculations. That way, you’re going to be sure that you’ll be buying more when prices are cheap, and selling more when prices are profitable.
Bad at math? Invest without fuss with trading signals
The steps required to know how much to buy or sell and when, can be tricky and involves quite a bit of algebra. Mathematics and technical analysis may not be everyone’s strongest suit. That’s why Blockcircle offers high quality trading signals to help you decide when to buy and when to sell cryptocurrencies.
Blockcircle is a private trading and investment management community of computer scientists, quant traders, financial engineers and executives that come together to combine all their skills and experiences to create high quality trading signals.
To give you a picture of how we work, we have sub-teams that focus on different aspects of the crypto market. We look for undervalued gems based on fundamental analysis, new token offerings on various centralized and decentralized exchanges, use off-chain and on-chain analytics, web traffic analytics, as well as the reliable and traditional technical analysis.
The group was founded in 2017 and has experienced two peak crypto bull markets in 2018 and 2021. These two periods of time have been a chance for many ordinary people to generate wealth, and become financially secure.
To learn more about what we can do for you, visit blockcircle.com.